Figures & data
Figure 1 The expression of NR2F1-AS1 in HCC. (A) NR2F1-AS1 expression was measured in HCC tissues and adjacent tissues via qRT-PCR. n=40. (B) Overall survival of patients was analyzed in high and low NR2F1-AS1 expression group. (C) NR2F1-AS1 level was detected in HCC cell lines and normal liver cells via qRT-PCR. *P<0.05.
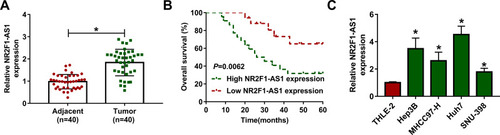
Figure 2 The effect of NR2F1-AS1 on hypoxia-induced glycolysis and migration in HCC. NR2F1-AS1 expression (A and B), glucose uptake (C and D), lactate production (E and F), ATP level (G and H), HK2 protein level (I and J) and migration (K and L) were detected in Hep3B and Huh7 cells with transfection of si-con, si-NR2F1-AS1 #1 or #2 under hypoxic condition via qRT-PCR, specific kit, Western blot and transwell assay. NC: non-transfected group; Normal: normoxic condition. *P<0.05 versus normal group, #P<0.05 versus si-con group.
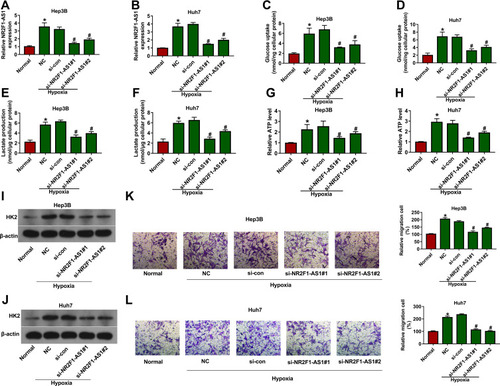
Figure 3 The association between NR2F1-AS1 and miR-140 in HCC. (A) The binding sites of NR2F1-AS1 and miR-140 were searched via starBase. (B and C) Luciferase activity was detected in Hep3B and Huh7 cells transfected with NR2F1-AS1-WT or NR2F1-AS1-MUT and miR-140 mimic or miR-con. (D and E) The levels of NR2F1-AS1 and miR-140 were detected in Hep3B and Huh7 cells after Ago2 RIP. (F) miR-140 expression was measured in HCC and adjacent tissues. (G) miR-140 abundance was examined in HCC cells and liver cells. (H) miR-140 expression was examined in Hep3B and Huh7 cells under hypoxic or normal conditions. *P<0.05.
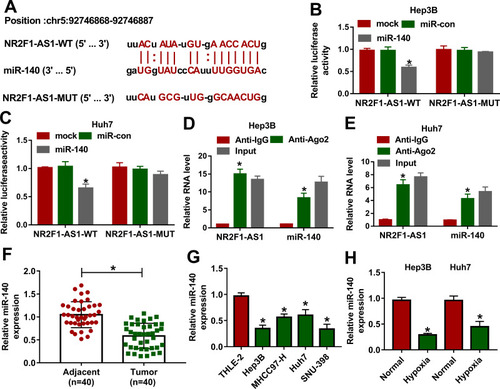
Figure 4 The association between miR-140 and HK2 in HCC. (A) The binding sites of miR-140 and HK2 were predicted via DIANA tool. (B and C) Luciferase activity was detected in Hep3B and Huh7 cells transfected with HK2-WT or HK2-MUT and miR-140 mimic or miR-con. (D and E) Luciferase activity was measured in Hep3B and Huh7 cells transfected with HK2-WT or HK2-MUT and si-NR2F1-AS1 or si-con. (F and G) The levels of HK2 and miR-140 were examined in Hep3B and Huh7 cells after Ago2 RIP. (H) HK2 mRNA abundance was measured in HCC and adjacent samples. (I) HK2 protein expression was measured in HCC cells and liver cells. (J) HK2 protein level was examined in Hep3B and Huh7 cells under hypoxic or normal conditions. *P<0.05.
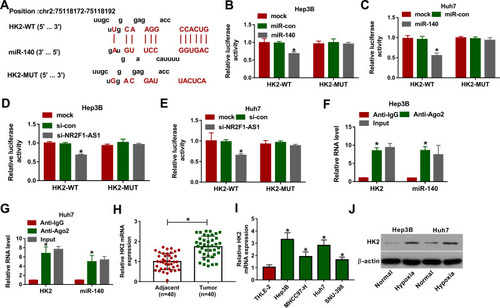
Figure 5 The association among NR2F1-AS1, miR-140 and HK2 in HCC. (A–C) The linear relationship among levels of NR2F1-AS1, miR-140 and HK2 was analyzed in HCC tissues. (D and E) miR-140 expression was measured in Hep3B and Huh7 cells transfected with vector, NR2F1-AS1, NR2F1-AS1 + miR-con, NR2F1-AS1 + miR-140, si-con, si-NR2F1-AS1, si-NR2F1-AS1 + in-miR-con or si-NR2F1-AS1 + in-miR-140. (F and G) HK2 protein levels were detected in Hep3B and Huh7 cells transfected with vector, NR2F1-AS1, NR2F1-AS1 + miR-con, NR2F1-AS1 + miR-140, si-con, si-NR2F1-AS1, si-NR2F1-AS1 + in-miR-con or si-NR2F1-AS1 + in-miR-140. *P<0.05.
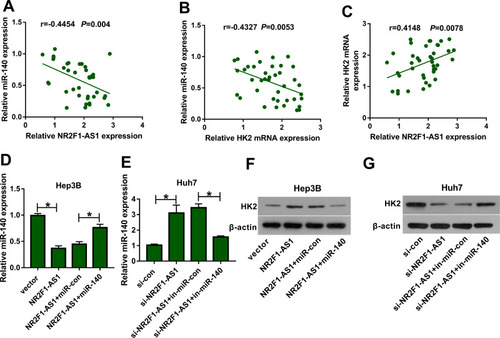
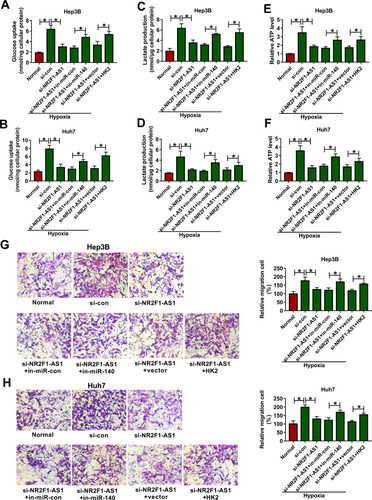
Figure 6 The effect of miR-140 or HK2 on NR2F1-AS1-mediated glycolysis and migration in HCC under hypoxic condition. Glucose uptake (A and B), lactate production (C and D), ATP level (E and F) and migration (G and H) were examined in Hep3B and Huh7 cells transfected with si-con, si-NR2F1-AS1, si-NR2F1-AS1 + in-miR-con, si-NR2F1-AS1 + in-miR-140, si-NR2F1-AS1 + vector or si-NR2F1-AS1 + HK2 overexpression vector. *P<0.05.