Figures & data
Figure 1 SOX8 is a target gene of miR-139 in TNBC cells. (A) The predicted binding sites of miR-139 and the SOX8 3ʹ-UTR region according to TargetScan. (B, C) Luciferase activity in cells following co-transfection with miR-139 mimic and luciferase reporters containing wild type (wt)- or mutated (mut)-SOX8 transcript in HCC1806 cells and BT549 cells. *P < 0.05.
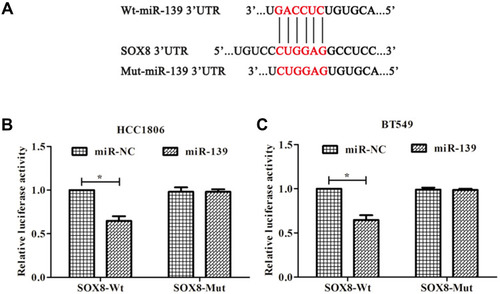
Figure 2 Effect of SOX8 on the proliferation of TNBC cells. (A and B) Expression of SOX8 mRNA in cells measured by RT-PCR and Western blotting analysis. (C and D) Transfection efficiency of SOX8 evaluated by RT-PCR and Western blotting analysis. (E) Cell viability detected by the CCK8 assay. (F) Cell proliferation was measured by plate clone formation. (G) Cell migration ability detected by transwell assay (400×). In each group, triplicate experiments were performed. The differences among groups were analyzed by ANOVA followed by the Dunnett’s t-test. Compared with MCF-10A cells, aP < 0.05; compared with the BC group, *P < 0.05; compared with the SOX8 group, #P < 0.05.
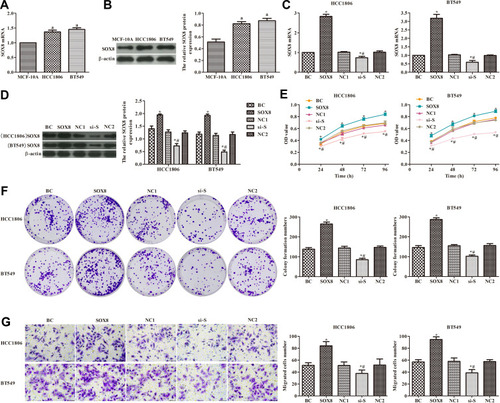
Figure 3 Effects of SOX8 on TNBC cell apoptosis and tumor sphere formation. (A) Apoptosis was detected by flow cytometry. (B) The expression of cleaved caspase-3 and cleaved caspase-9 was analyzed by Western blotting analysis. (C) Tumorigenicity of cells was determined by in vitro tumor sphere formation assays (100×). In each group, experiments were performed in triplicate. The differences among groups were analyzed by ANOVA followed by the Dunnett’s t-test. Compared with the BC group, *P < 0.05; compared with the SOX8 group, #P < 0.05.
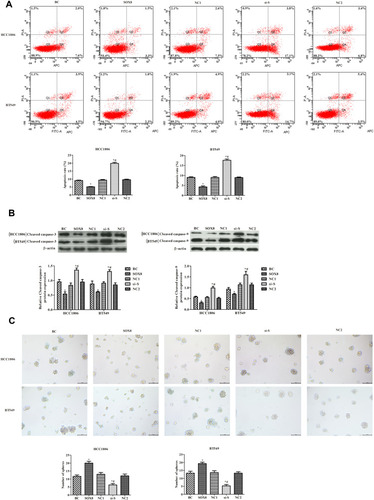
Figure 4 Effects of miR-139 on the proliferation of TNBC cells. (A) RT-PCR was used to detect the expression of miR-139 in cells. (B) Transfection efficiency of miR-139 evaluated by RT-PCR. (C and D) RT-PCR and Western blotting analysis were used to detect the expression of SOX8 in cells. (E) Cell viability detected by CCK8 assay. (F) Cell proliferation was measured by plate clone formation. (G) Transwell assays were used to detect cell migration ability (400×). In each group, experiments were performed in triplicate. The differences among groups were analyzed by ANOVA with followed by the Dunnett’s t-test. Compared with MCF-10A cells, aP < 0.05; compared with the BC group, *P < 0.05; compared with the miR-NC group, ^P < 0.05.
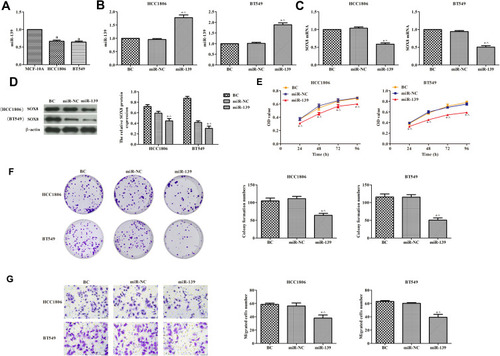
Figure 5 Effects of miR-139 on TNBC cell apoptosis and tumor sphere formation. (A) Cell apoptosis was detected by flow cytometry. (B) The expression of cleaved caspase-3 and cleaved caspase-9 was analyzed by Western blotting analysis. (C) Tumorigenicity of cells was determined by in vitro tumor sphere formation assays (100×). In each group, experiments were performed in triplicate. The differences among groups were analyzed by ANOVA followed by the Dunnett’s t-test. Compared with the BC group, *P < 0.05; compared with the miR-NC group, ^P < 0.05.
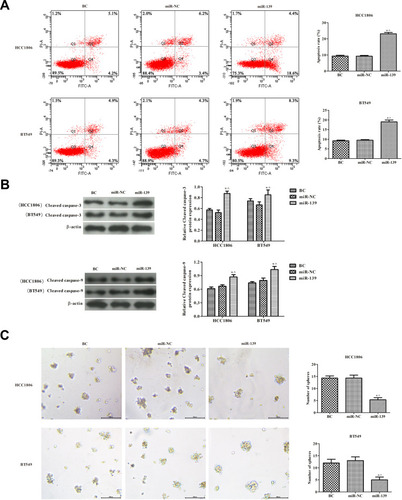
Figure 6 Effects of miR-139 on the proliferation of TNBC cells by targeting SOX8. (A) CCK8 was used to detect cell viability. (B) Plate clone formation experiment was used to detect cell proliferation. (C) Transwell assay was used to detect cell migration (400×). In each group, experiments were performed in triplicate. The differences among groups were analyzed by ANOVA followed by the Dunnett’s t-test. Compared with the BC group, *P < 0.05; compared with the miR-139 group, &P < 0.05.
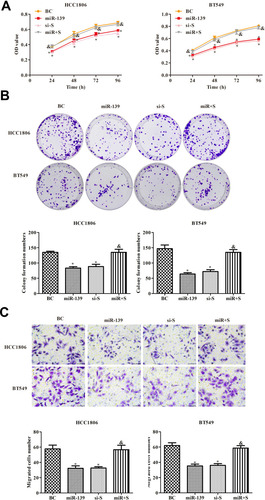
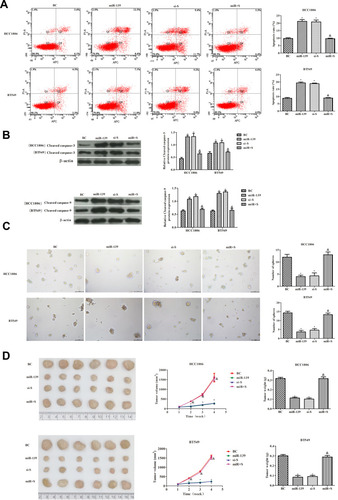
Figure 7 Effects of miR-139 targeting SOX8 on TNBC cell apoptosis and tumor formation. (A) Apoptosis of HCC1806 and BT549 cells measured by flow cytometry. (B) The expression of cleaved caspase-3 and cleaved caspase-9 was analyzed by Western blotting analysis. (C) In vitro, tumor sphere formation assays were used to detect the tumorigenicity of HCC1806 and BT549 cells (100×). (D) In vivo, tumor volume and tumor weight of TNBC cells. In each group, there were six mice. The differences among groups were analyzed by ANOVA followed by Dunnett’s t-test. Compared with the BC group, *P < 0.05; compared with the mir-139 group, &P < 0.05.