Figures & data
Table 1 Primers Sequences Used for PCR
Figure 1 Circ_0061825 was overexpressed in BC tissues and cells. Circ_0061825 expression by qRT-PCR in 30 pairs of BC tissues and matched normal tissues (A), MCF-10A, MCF-7 and MDA-MB-231 cells (B). (C) Circ_0061825 and GAPDH levels by qRT-PCR in total cellular RNA incubated with RNase R. (D) The levels of circ_0061825 and TFF1 linear mRNA by qRT-PCR in MCF-7 and MDA-MB-231 cells incubated with actinomycin D. (E) Circ_0061825 expression by qRT-PCR in the cytoplasmic and nuclear fraction of MCF-7 and MDA-MB-231 cells. *P < 0.05.
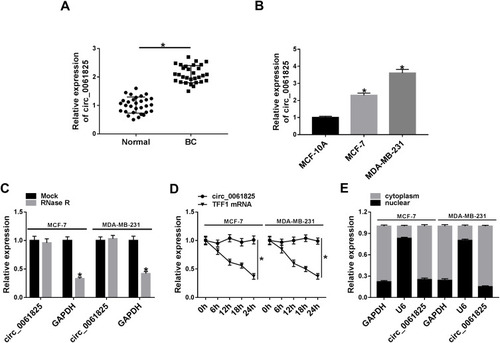
Figure 2 Circ_0061825 knockdown hindered BC cell malignant behaviors and enhanced apoptosis in vitro. (A) Circ_0061825 expression by qRT-PCR in MCF-7 cells transfected with si-NC, si-circ_0061825-1, si-circ_0061825-2 or si-circ_0061825-3. MCF-7 and MDA-MB-231 cells were transfected with si-NC or si-circ_0061825-2, followed by the measurement of circ_0061825 expression by qRT-PCR (B), cell viability by CCK-8 assay (C), colony formation using a standard colony formation assay (D), cell migration by wound-healing and transwell assays (E and F), cell invasion by transwell assay (G), cell cycle progression (H) and cell apoptosis (I) by flow cytometry. *P < 0.05 or **P < 0.01.
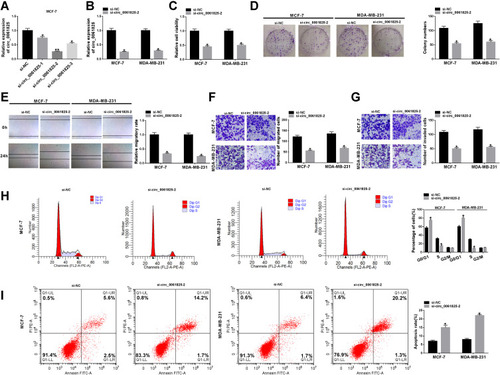
Table 2 The Putative Targeted miRNAs of Circ_0061825
Figure 3 Circ_0061825 acted as a molecular sponge of miR-593-3p. (A) Schematic of the predicted complementary sequence for miR-593-3p in circ_0061825 and the mutation of the seed sequence. (B) MiR-593-3p expression by qRT-PCR in MCF-7 and MDA-MB-231 cells transfected with miRNA NC or miR-593-3p mimic. (C) Dual-luciferase reporter assays in the two BC cells. (D) MiR-593-3p expression in MCF-7 and MDA-MB-231 cells transfected with inhibitor NC or miR-593-3p inhibitor. (E) Dual-luciferase reporter assays in the two BC cells. MiR-593-3p expression by qRT-PCR in 30 pairs of BC tissues and matched normal tissues (F), MCF-10A, MCF-7 and MDA-MB-231 cells (G), MCF-7 and MDA-MB-231 cells transfected with si-NC, si-circ_0061825-2, si-circ_0061825-2+inhibitor NC or si-circ_0061825-2+miR-593-3p inhibitor (H). *P < 0.05.
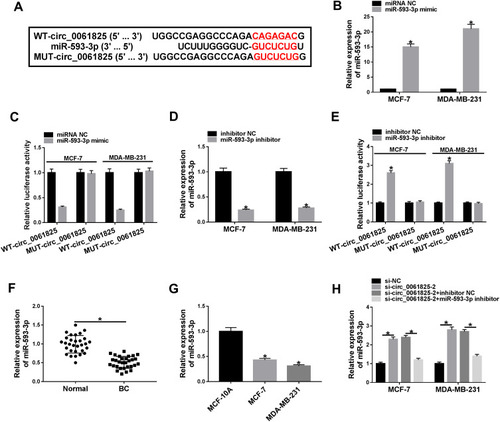
Figure 4 The knockdown of circ_0061825 repressed BC cell malignant progression in vitro by miR-593-3p. MCF-7 and MDA-MB-231 cells were transfected with si-NC, si-circ_0061825-2, si-circ_0061825-2+inhibitor NC or si-circ_0061825-2+miR-593-3p inhibitor. (A) CCK-8 assay for cell viability. (B) A standard colony formation assay for cell colony formation. (C) Wound-healing assay for cell migration. (D) Transwell assay for cell migration and invasion. (E and F) Flow cytometry for cell cycle progression and apoptosis. *P < 0.05.
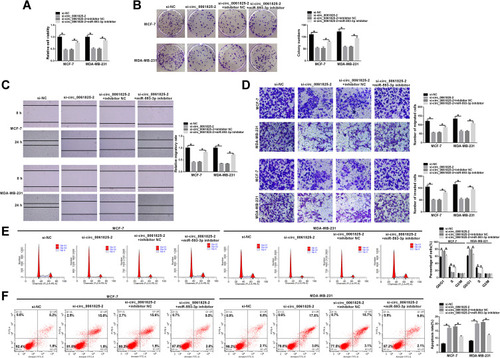
Figure 5 MiR-593-3p directly interacted with the 3ʹUTR of FGFR3. (A) Schematic model of the putative miR-593-3p binding sequence in the 3ʹUTR of FGFR3 mRNA and mutated the miR-593-3p-binding sequence. (B and C) Dual-luciferase reporter assay in MCF-7 and MDA-MB-231 cells. FGFR3 protein expression by Western blot in 3 pairs of BC tissues and matched normal tissues (D), MCF-10A, MCF-7 and MDA-MB-231 cells (E). *P < 0.05.
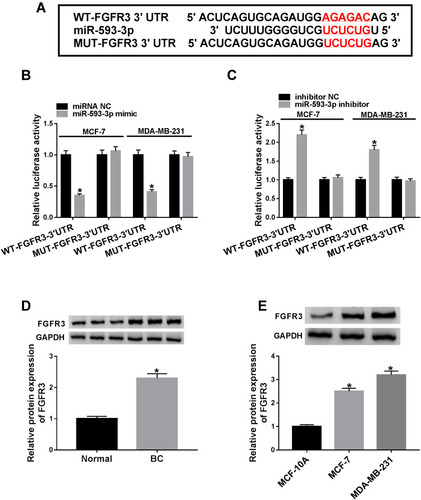
Figure 6 MiR-593-3p overexpression hindered BC cell malignant progression in vitro by FGFR3. (A) FGFR3 expression by Western blot in MCF-7 and MDA-MB-231 cells transfected with pc-NC or pc-FGFR3. MCF-7 and MDA-MB-231 cells were transfected with miRNA NC, miR-593-3p mimic, miR-593-3p mimic+pc-NC, miR-593-3p mimic+pc-FGFR3, followed by the detection of FGFR3 expression by Western blot (B), cell viability by CCK-8 assay (C), cell colony formation using a standard colony formation assay (D), cell migration and invasion by wound-healing or transwell assay (E and F), cell cycle progression (G) and apoptosis (H) by flow cytometry. *P < 0.05.
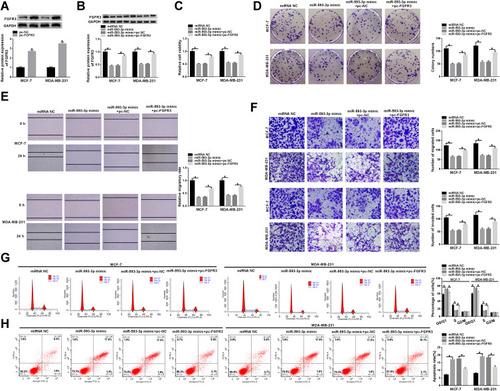
Figure 7 Circ_0061825 modulated FGFR3 expression through sponging miR-593-3p. (A) FGFR3 protein expression by Western blot in MCF-7 and MDA-MB-231 cells transfected with si-NC, si-circ_0061825-2, si-circ_0061825-2+inhibitor NC or si-circ_0061825-2+miR-593-3p inhibitor. *P < 0.05.
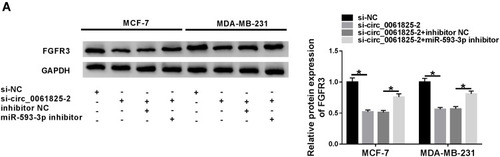
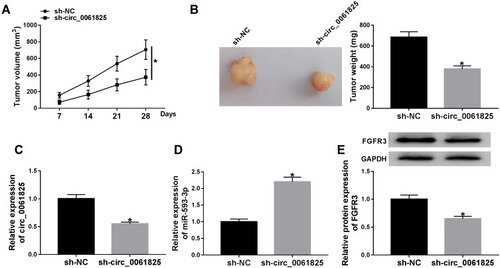
Figure 8 Circ_0061825 knockdown mitigated tumor growth in vivo. sh-circ_0061825-transduced or sh-NC-infected MDA-MB-231 cells were subcutaneously implanted into the nude mice (n = 6 per group). 28 days later, all mice were euthanized, and tumor tissues were removed. (A) After 7 days of implantation, tumor volume measurement began and was performed every week. (B) Tumor average weight was calculated and representative pictures were photographed. Circ_0061825 expression (C) and miR-593-3p level (D) by qRT-PCR, and FGFR3 expression by Western blot (E) in the xenograft tissues. *P < 0.05.