Figures & data
Figure 1 The expression of SNHG10 and miR-621 was significantly altered in AML. The expression of SNHG10 (A) and miR-621 (B) in BMMNCs from both AML patients (n = 60) and healthy controls (n = 60) was determined by RT-qPCR. The expression levels of SNHG10 and miR-621 in BMMNCs were expressed as average values of three technical replicates. **p < 0.01.
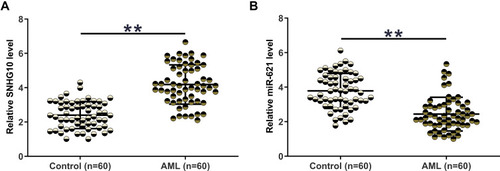
Figure 2 SNHG10 and miR-621 were inversely correlated. Correlations between SNHG10 and miR-621 across samples of BMMNCs from both AML patients (A) and healthy controls (B) were analyzed by linear regression. SNHG10 and miR-621 were inversely correlated with each other.
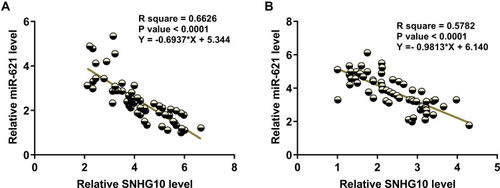
Figure 3 High level of SNHG10 is associated with poor survival of AML patients. Kaplan–Meier curve for the analysis of the association between the survival of AML patients and the expression level of SNHG10 or miR-621. Patients with high lncRNA SNHG10 expression or low miR-621 expression had poorer survival.
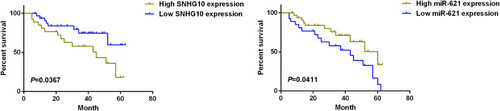
Figure 4 SNHG10 targeted miR-621 to downregulate its expression in AML cells. Bioinformatics analysis performed using IntaRNA 2.0 (A). Kasumi-3 and Kasumi-6 cells were transfected with miR-621 mimic and pcDNA3.1-SNHG10, followed by the confirmation of transfections using RT-qPCR (B). The effect of miR-621 overexpression on SNHG10 (C), and the effect of SNHG10 overexpression on miR-621 (D) were also analyzed by RT-qPCR. Mean ± SD values were used to express data from 3 biological replicates. *p < 0.05.
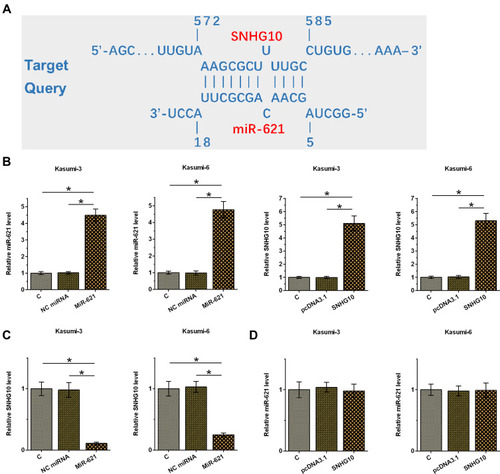
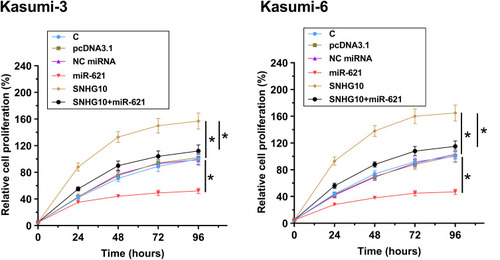
Figure 5 SNHG10 targeted miR-621 to inhibit the proliferation of AML cells. The effects of miR-621 and SNHG10 on regulating the proliferation of Kasumi-3 and Kasumi-6 cells were analyzed by CCK-8 assay. Mean ± SD values were used to express data from 3 biological replicates. *p < 0.05.