Figures & data
Figure 1 GA treatment inhibits GC progression. (A) Colony formation assay revealed that the effect of GA treatment on the proliferation of AGS and HGC-27 cells. (B and C) MTT assay demonstrated that the effect of GA treatment on the viability of AGS and HGC-27 cells. (D and E) Transwell assay showed that the effect of GA treatment on the migration and invasion of AGS and HGC-27 cells. (F) Flow cytometry analysis indicated that GA treatment induced cell apoptosis in AGS and HGC-27 cells.*P < 0.05.
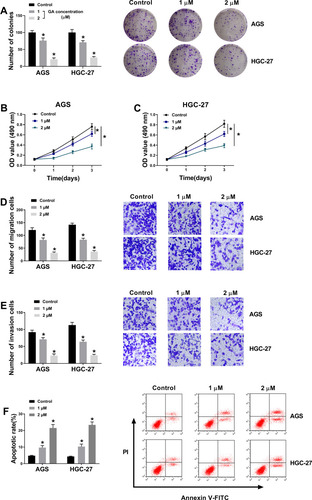
Figure 2 Circ_ASAP2 expression is downregulated in GA-induced GC cells. (A) Circ_ASAP2 expression was detected by qRT-PCR in GA-induced AGS and HGC-27 cells, AGS and HGC-27 cells and GES-1 cells. (B–E) RNase R digestion and Actinomycin D treatment assays showed that circ_ASAP2 was more stable than ASAP2. (F) QRT-PCR was employed to detect circ_ASAP2 expression in GC tissues and normal gastric tissues. *P < 0.05.
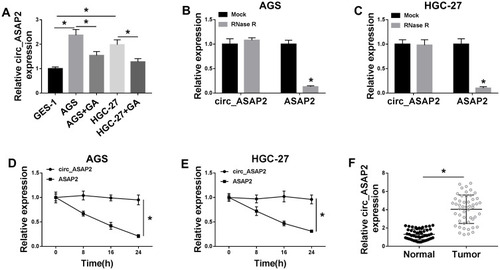
Figure 3 Circ_ASAP2 abolishes the effects of GA exposure on GC development. (A) The transfection efficiency of circ_ASAP2 was detected by qRT-PCR. (B) Colony formation assay showed that the effect between GA and circ_ASAP2 on the proliferation of AGS and HGC-27 cells. (C and D) MTT assay explained that circ_ASAP2 decreased the inhibition effect of GA on cell viability in AGS and HGC-27 cells. (E and F) The cell migration and invasion were determined by transwell assay in both AGS and HGC-27 cells. (G) Flow cytometry assay investigated that the impacts between GA and circ_ASAP2 on cell apoptosis AGS and HGC-27 cells. *P < 0.05.
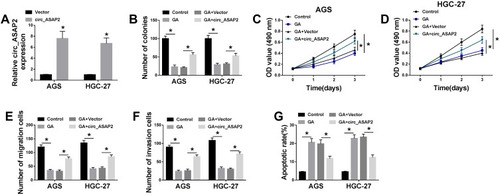
Figure 4 Circ_ASAP2 binds to miR-33a-5p. (A) StarBase v3.0 online database predicted that circ_ASAP2 contained the binding sequence of miR-33a-5p. (B and C) Dual-luciferase reporter assay verified that circ_ASAP2 was a sponge of miR-33a-5p in both AGS and HGC-27 cells. (D) QRT-PCR analysis showed that the effect of circ_ASAP2 overexpression on miR-33a-5p expression in both AGS and HGC-27 cells. (E) QRT-PCR analysis showed that the expression level of miR-33a-5p in GES-1, AGS and HGC-27 cells and GA-induced AGS and HGC-27 cells. (F) QRT-PCR results determined miR-33a-5p expression in GC tissues and paracancerous normal gastric tissues. (G) Pearson correlation analysis showed that miR-33a-5p was negatively correlated with circ-ASAP2. *P < 0.05.
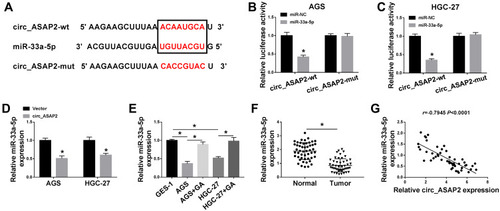
Figure 5 MiR-33a-5p blocks the effects of circ_ASAP2 overexpression on GA-mediated GC progression. (A) The effects between circ_ASAP2 and miR-33a-5p on miR-33a-5p expression were detected by qRT-PCR. (B) Colony formation assay demonstrated that the impacts among GA, circ_ASAP2 and miR-33a-5p on cell proliferation in AGS and HGC-27 cells. (C and D) MTT assay revealed the effects among GA, circ_ASAP2 and miR-33a-5p on cell viability in both AGS and HGC-27 cells. (E and F) Transwell assay showed that the effects among GA, circ_ASAP2 and miR-33a-5p on the migration and invasion of AGS and HGC-27 cells. (G) Flow cytometry showed that circ_ASAP2 attenuated GA-induced promotion effect on cell apoptosis in AGS and HGC-27 cells, whereas this consequence was relieved by miR-33a-5p. *P < 0.05.
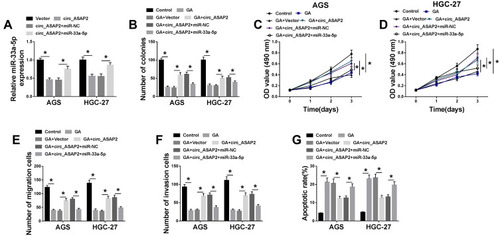
Figure 6 Circ_ASAP2 functions as a sponge of miR-33a-5p to target CDK7. (A) Starbase v3.0 online database predicted the binding sites between miR-33a-5p and CDK7. (B and C) The luciferase activities were detected by dual-luciferase reporter assay in AGS and HGC-27 cells. (D) QRT-PCR revealed the transfection efficiency of miR-33a-5p mimics and miR-33a-5p inhibitors. (E) QRT-PCR evaluated CDK7 mRNA expression after miR-NC, anti-miR-NC miR-33a-5p or anti-miR-33a-5p transfection in AGS and HGC-27 cells. (F) The CDK7 protein expression was detected by Western blot in both AGS and HGC-27 cells. (G and H) The mRNA and protein levels of CDK7 were severally detected by qRT-PCR and Western blot in GES-1 cell, AGS and HGC-27 cells and GA-mediated AGS and HGC-27 cells. (I) The CDK7 protein expression in GC tissues was determined by Western blot. (J) The mRNA expression level of CDK7 in GC tissues and normal gastric tissues was assessed by qRT-PCR. (K) The linear relationship between miR-33a-5p and CDK7 was analyzed by Pearson correlation analysis. (L) The effects between circ_ASAP2 and miR-33a-5p on CDK7 mRNA expression were determined by qRT-PCR. (M) Western blot analysis showed the effects between circ_ASAP2 and miR-33a-5p on CDK7 protein expression. *P < 0.05.
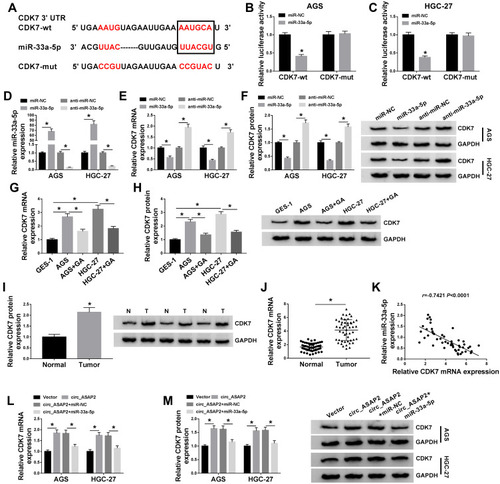
Figure 7 CDK7 silencing attenuates the effects of miR-33a-5p inhibitor on GA-induced GC progression. (A and B) The mRNA and protein levels of CDK7 were detected in both AGS and HGC-27 cells by qRT-PCR and Western blot, respectively. (C) Colony formation assay was applied to determine the effects between miR-33a-5p inhibitor and CDK7 repression on cell colony-forming ability under GA treatment in both AGS and HGC-27 cells. (D and E) MTT assay was employed to investigate the influences between miR-33a-5p inhibitor and CDK7 repression on cell viability after GA exposure in both AGS and HGC-27 cells. (F and G) The effects between miR-33a-5p inhibitor and CDK7 repression on migration and invasion of GA-induced AGS and HGC-27 cells were detected by transwell assay. (H) Flow cytometry analysis was carried to evaluate cell apoptosis after anti-miR-NC, anti-miR-33a-5p, anti-miR-33a-5p+si-NC or anti-miR-33a-5p+si-CDK7 transfection in both AGS and HGC-27 cells. *P < 0.05.
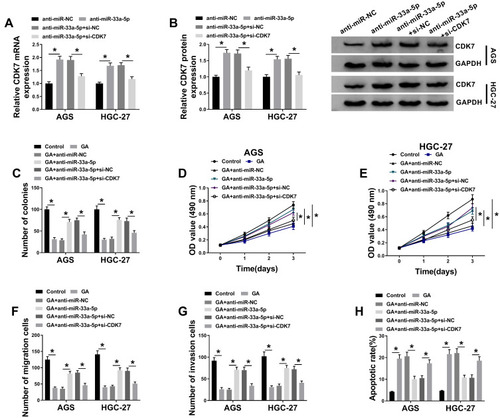
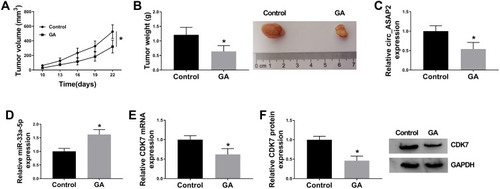
Figure 8 GA exposure decreases GC growth in vivo. (A) GA exposure inhibited tumor volume in vivo. (B) The tumor weight was decreased by GA treatment in vivo. (C) QRT-PCR detected circ_ASAP2 expression in GA-mediated GC tissues in vivo. (D) QRT-PCR determined miR-33a-5p expression in GA-mediated GC tissues in vivo. (E and F) The mRNA and protein levels of CDK7 were determined by qRT-PCR and Western blot, respectively, in GC tissues treated GA. *P < 0.05.