Figures & data
Table 1 Clinicopathological Characteristics of Non-TACE Group Compare with PA-TACE Group Before and After PSM
Table 2 Recurrence Rate and Overall Survival of Non-TACE Group Compare with PA-TACE Groups Before and After PSM
Figure 1 (A) Comparison of recurrence rate between the PA-TACE and non-TACE groups before PSM. (B) Comparison of overall survival rate between the PA-TACE and non-TACE groups before PSM. (C) Comparison of recurrence rate between the PA-TACE and non-TACE groups after PSM. (D) Comparison of overall survival rate between the PA-TACE and non-TACE groups after PSM.
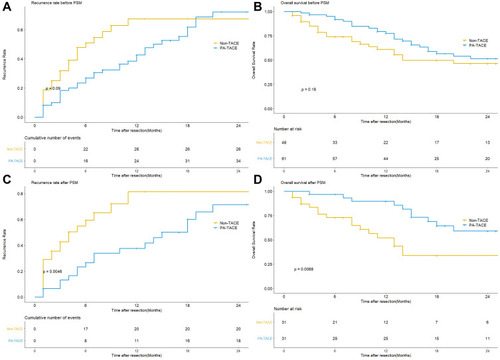
Table 3 Univariate and Multivariate Analysis of Recurrence and Overall Survival for HCC with BDTT Before PSM
Table 4 Univariate and Multivariate Analysis of Recurrence and Overall Survival for HCC with BDTT After PSM
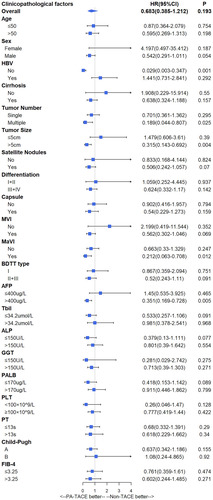
Figure 2 Subgroup analysis of recurrence.
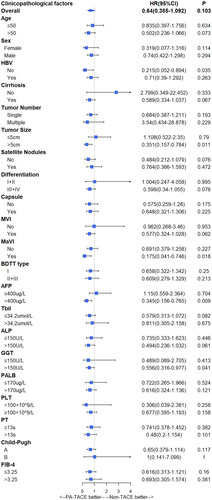
Figure 3 Subgroup analysis of overall survival.