
Figures & data
Figure 1 Hyperin inhibits proliferation in gastric cancer cells. (A) The cell viability was measured with the CCK8 assay. n=10, *P<0.05. (B) The number of cell clones was counted under the microscope, and six separate experiments were performed for average. *P<0.05, **P<0.01. (C) The percentage of cells in G1, S and G2/M phases of the cell cycle is indicated. n=5, *P<0.05, **P<0.01. (D) Cell proliferation capacity was monitored by the EdU assay. n=6, *P<0.05.
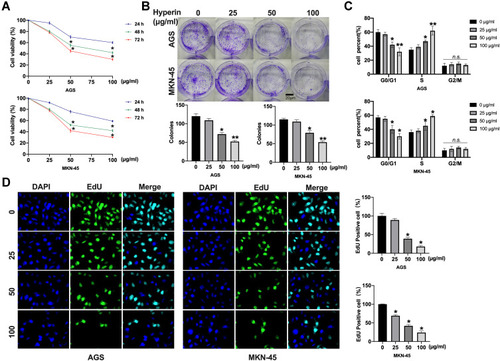
Figure 2 Hyperin inhibits migration and invasion in AGS and MKN-45 cells. (A) Wound healing assay of the migratory ability of AGS and MKN-45 cells. Migration viability (%) = {(the initialized width of the scratch) - (the final width of the scratch)}/(the initialized width of the scratch). n=6, *P<0.05. (B) Representative images from Transwell migration assay show Hyperin-treated cells were analyzed for their migration properties by Transwell migration assay. n=6, *P<0.05. (C) Cell invasion was determined by Transwell invasion assay. n=6, *P<0.05.
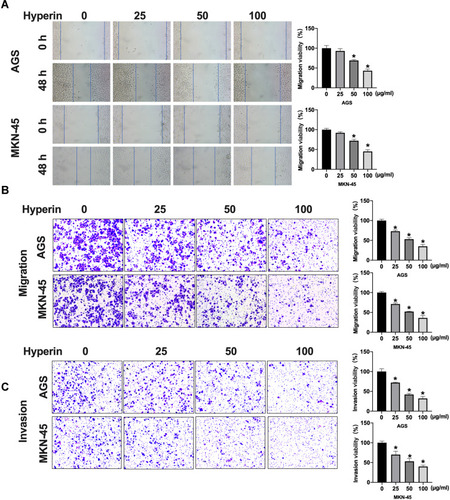
Figure 3 Hyperin induces apoptosis in gastric cancer cells. (A) Apoptosis of AGS cells and MKN-45 cells detected by TUNEL cell apoptosis assay. n=6, *P<0.05, **P<0.01. (B) Flow cytometry was performed to detect apoptosis. n=6, *P<0.05, **P<0.01. (C) The activity of caspase 3 and caspase 9 were detected by ELISA. n=4, *P<0.05. (D) The protein level of Bcl2, Bax, cleaved-caspase3 in AGS and MKN-45 cells. n=5, *P<0.05.
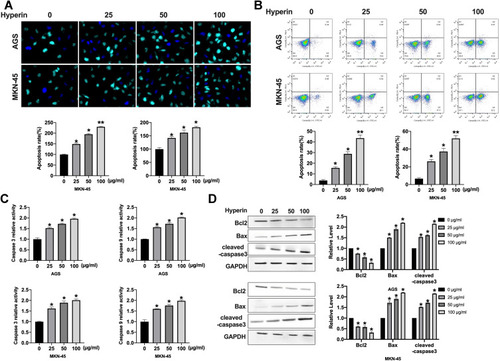
Figure 4 Hyperin blocked wnt/β-catenin signal pathway. (A) The TOP/FOP luciferase activity was detected in AGS and MKN-45 cells. n=5, *P<0.05. (B) The protein level of DKK1, NKD1, GSK3β, β-catenin, and wnt1 in AGS and MKN-45 cells. n=5, *P<0.05.
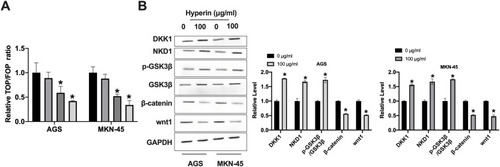
Figure 5 CP21 prevents Hyperin function on gastric cancer cells by activating wnt/β-catenin signal pathway. (A) The cell viability was measured with the CCK8 assay. n=8, *P<0.05, **P<0.01, #P<0.05. (B) The number of cell clones was counted under the microscope, and six separate experiments were performed for average. *P<0.05, #P<0.05. (C) Wound healing assay of the migratory ability of AGS and MKN-45 cells. n=6, *P<0.05, #P<0.05. (D) Representative images from Transwell migration assay show cells were analyzed for their migration properties by Transwell migration assay. n=6, *P<0.05, #P<0.05. (E) Cell invasion was determined by Transwell invasion assay. n=6, *P<0.05. #P<0.05. (F) Flow cytometry was performed to detect apoptosis. n=6, *P<0.05, #P<0.05.
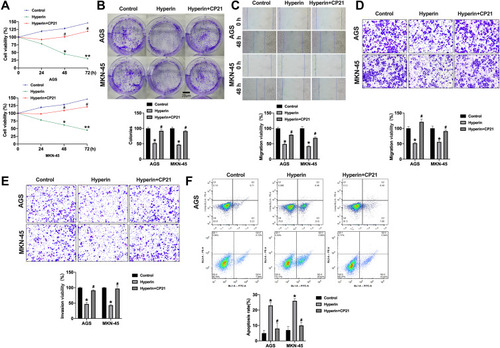
Figure 6 Hyperin significantly reduces tumor growth in vivo. (A) Tumors removed from the mice 30 days after Hyperin and Control treated, respectively n=5. (B and C) Tumor volume and weight were shown after the tumors were collected. n=5, *P<0.05. (D) H&E staining and TUNEL assay were performed. (E) Representative image of ki-67, caspase3, wnt1, and β-catenin IHC staining. (F) The protein level of Bcl2, Bax, cleaved-caspase3 in tumor tissues. n=5, *P<0.05. (G) The protein level of DKK1, NKD1, GSK3β, β-catenin, and wnt1 in tumor tissues. n=5, *P<0.05.
