Figures & data
Figure 1 NC-CT and CE-CT scans of GACs with different DP-cCAV. CT images in the noncontrast phase (A), arterial phase (B), portal venous phase (C) and delayed phase (D) showed a thickened gastric wall in a patient of DP-cCAVhigh group. CT images in the noncontrast phase (E), arterial phase (F), portal venous phase (G) and delayed phase (H) showed a thickened gastric wall in a patient of the DP-cCAVlow group.
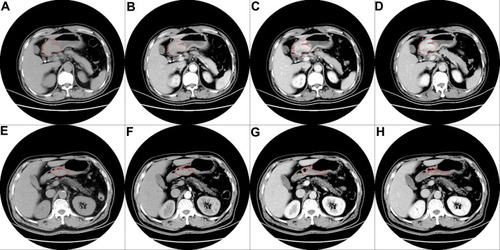
Table 1 Baseline Characteristics of Patients with GAC According to CT Value Stratification
Table 2 Univariable and Multivariable Cox Proportional Hazards Regression Analyses of Clinical and Radiographic Features for Overall Survival in Patients with Gastric Adenocarcinoma
Table 3 Univariate and Multivariate Analysis of Clinical and Radiographic Features for Overall Survival in Patients with Gastric Adenocarcinoma
Figure 2 Overall survival for GAC patients according to CT value stratification.
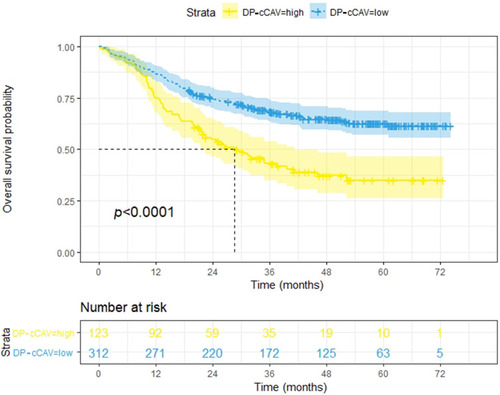
Figure 3 Subgroup analysis for GAC patients.
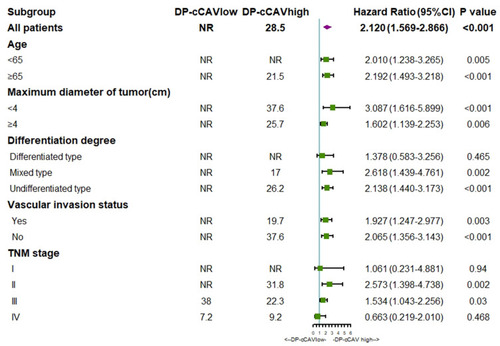
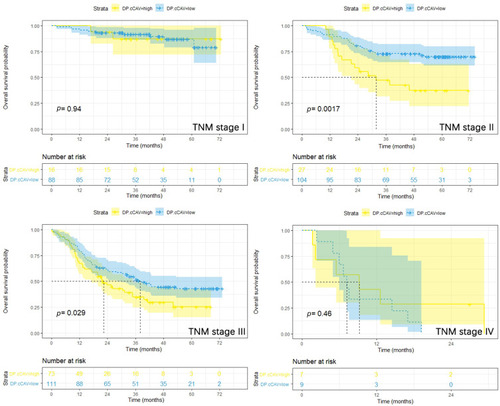
Figure 4 Subgroup analysis for GAC patients based on TNM stage. Figures display overall survival for patients with TNM stage I, II, III, IV GAC.