Figures & data
Table 1 Expression of seven Significantly Deregulated miRNAs Between Localized PCa Patients and Metastatic PCa Patients Determined by NGS Technology
Table 2 Expression of Significantly Deregulated miRNAs Between PCa Patients and Healthy Controls Determined by NGS Technology
Figure 1 Expression of 5 candidate exosomal miRNAs in the urine samples of the validation cohort. Relative expression levels of urinary exosomal miR-375 (A), miR-16-2-3p (B), miR-486-3p (C), miR-451a (D), and miR-486-5p (E) in patients with PCa. Data presented as relative fold changes.
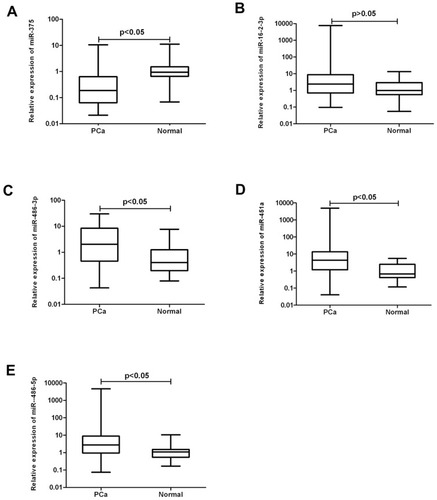
Figure 2 Receiver operator characteristic curve (ROC) for 4 individual miRNAs (miR-375, miR-451a, miR-486-3p and miR-486-5p) and their combination to differentiate between PCa patients and healthy controls.
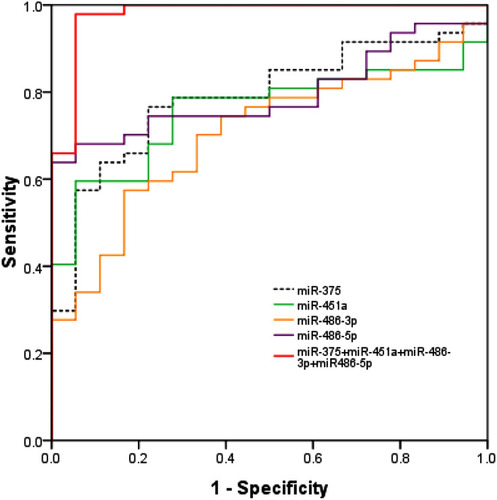
Table 3 Clinical Characteristics of Participants in the qRT-PCR Cohort
Figure 3 Expression of urinary exosomal miRNAs in PCa patients and BPH patients. Relative expression levels of urinary exosomal miR-375 (A), miR-451a (B), miR-486-3p (C), and miR-486-5p (D). Data are presented as relative fold changes.
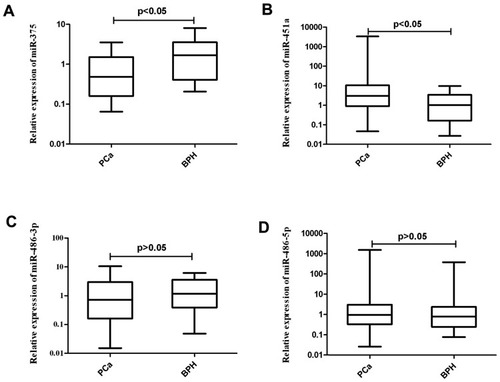
Figure 4 Evaluation of the ability of the miRNA-based panel and PSA to differentiate between patients with PCa and patients with BPH. Receiver operator characteristic (ROC) curve for PSA, two individual miRNAs (miR-375 and miR-451a) and their combination to differentiate between two groups consisting of 47 PCa patients and 29 BPH patients.
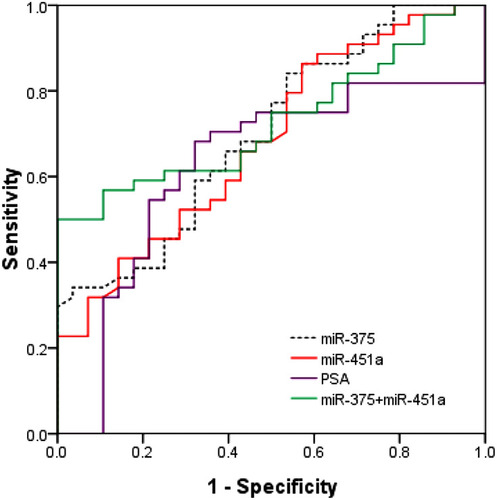
Figure 5 Expression of urinary exosomal miRNAs in localized PCa and metastatic PCa. Relative expression levels of urinary exosomal miR-375 (A), miR-451a (B), miR-486-3p (C), and miR-486-5p (D) in localized PCa patients and metastatic PCa patients. Data presented as relative fold changes.
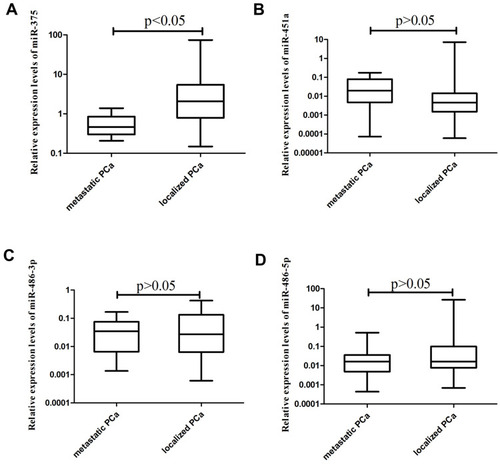
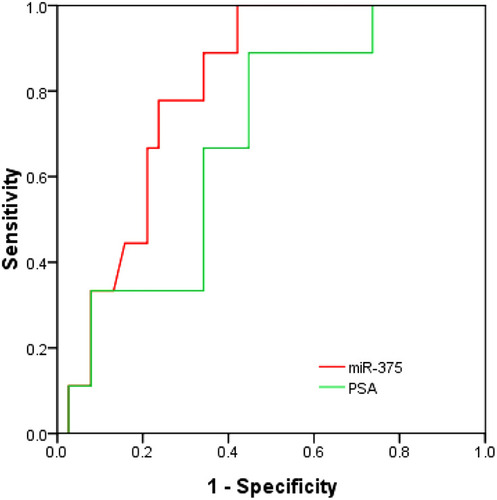
Figure 6 Receiver-operating characteristic curve (ROC) for urinary exosomal miR-375 and PSA to differentiate between localized PCa patients and metastatic PCa patients.