Figures & data
Table 1 Correlation Between CircNFIX Expression and Clinicopathological Parameters of NSCLC Patients
Table 2 Primers Sequences Used for PCR
Figure 1 CircNFIX was overexpressed in NSCLC and predicted poor prognosis of NSCLC patients. CircNFIX expression by qRT-PCR in 55 pairs of NSCLC tissues and adjacent non-tumor tissues (A), HBE1, A549, H1299, H1975 and H1650 cells (B). (C) Analysis for the overall survival of NSCLC patients in high (n = 27) or low (n = 28) circNFIX level group using Kaplan–Meier survival analysis and Log rank test.
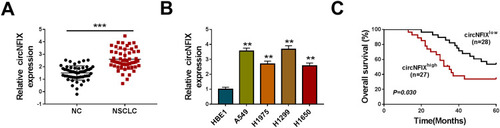
Figure 2 CircNFIX knockdown repressed NSCLC malignant progression in vitro and in vivo. (A) CircNFIX expression by qRT-PCR in A549 and H1299 cells transduced with sh-NC, sh-circ#1 or sh-circ#2. Cell viability by CCK-8 assay (B), cell migration and invasion by transwell assay (C and D), glucose uptake and lactate product using the assay kits (E and F), the levels of MMP9, MMP2 and HK2 by Western blot (G) in sh-NC- or sh-circ#1-transduced A549 and H1299 cells. (H and I) sh-circ#1-transduced or sh-NC-infected A549 cells were subcutaneously implanted into nude mice (n = 6 per group), and tumor volume was measured every week after 7 days implantation, tumor image was photographed and tumor weight was gauged at the end of the animal experiments.
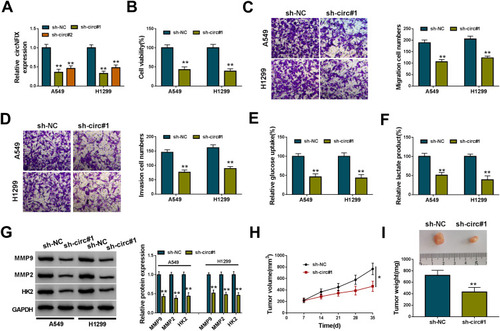
Figure 3 CircNFIX acted as a sponge of miR-212-3p. (A) MiR-212-3p expression by qRT-PCR in 55 pairs of NSCLC tissues and adjacent non-tumor tissues. (B) The correlation between miR-212-3p expression and circNFIX level in NSCLC tissues using the Spearman test. (C) Schematic of the complementary sequence for miR-212-3p within circNFIX identified by starBase v.2 software and the mutation of the seed region. (D) Relative luciferase activity in A549 and H1299 cells cotransfected with circNFIX-WT or circNFIX-MUT and miR-212-3p mimic or miR-NC mimic. (E) The enrichment level of circNFIX by Bio-miR-212-3p or Bio-NC in both A549 and H1299 cells. (F) MiR-212-3p expression by qRT-PCR in A549 and H1299 cells transduced with sh-NC, sh-circ#1.
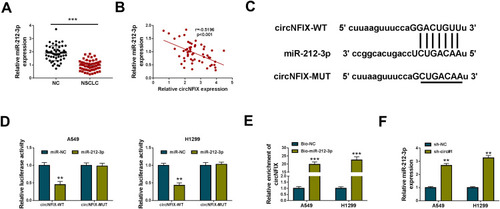
Figure 4 CircNFIX knockdown repressed NSCLC cell malignant progression in vitro by miR-212-3p. (A) MiR-212-3p expression by qRT-PCR in A549 and H1299 cells transfected with anti-NC or anti-miR-212-3p. sh-NC- or sh-circ#1-transduced A549 and H1299 cells were transfected with anti-NC or anti-miR-212-3p, followed by the assessment of cell viability by CCK-8 assay (B), cell migration and invasion by transwell assay (C and D), glucose uptake and lactate product using the assay kits (E and F), MMP9, MMP2 and HK2 levels by Western blot (G).
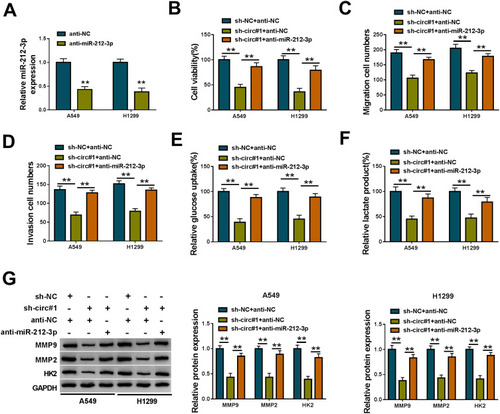
Figure 5 CircNFIX regulated ADAM10 expression by acting as a sponge of miR-212-3p. (A) Schematic of the putative target sequence for miR-212-3p within the 3ʹUTR of ADAM10 mRNA and the mutation of the target sequence. (B) Luciferase assays in A549 and H1299 cells transfected with ADAM10-3ʹUTR-WT or ADAM10-3ʹUTR-MUT, together with miR-212-3p mimic or miR-NC mimic. ADAM10 mRNA and protein levels by qRT-PCR and Western blot in A549 and H1299 cells transfected with miR-NC mimic or miR-212-3p mimic (C and D), sh-NC- or sh-circ#1-transduced A549 and H1299 cells transfected with anti-NC or anti-miR-212-3p (E and F), NSCLC tissues and adjacent non-tumor tissues (G and H).
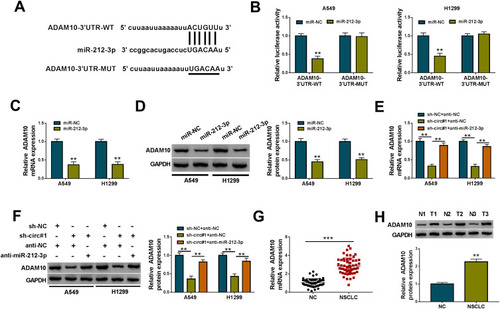
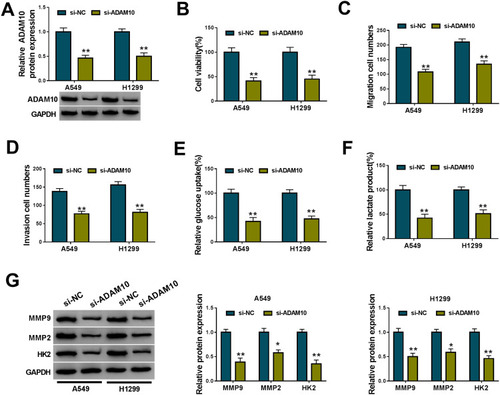
Figure 6 ADAM10 knockdown hampered NSCLC cell malignant progression in vitro. A549 and H1299 cells were transiently transfected with si-NC or si-ADAM10. (A) ADAM10 expression by Western blot in transfected cells. (B) CCK-8 assay for cell viability. (C and D) Transwell assay for cell migration and invasion. (E and F) Glucose uptake and lactate product using the assay kits. (G) Western blot for MMP9, MMP2 and HK2 levels in transfected cells.