Figures & data
Table 1 Association Between the Clinicopathologic Characteristics and Hsa_circ_0084927 Expression in Patients with Cervical Cancer
Figure 1 Characteristic and expression of hsa_circ_0084927 in CC. (A) Schematic illustration exhibiting the circularization of ESRP1 exons 7 to 9 forming hsa_circ_0084927. (B) QRT-PCR was used to analyze hsa_circ_0084927 expression in 46 paired CC tissues and adjacent non-tumor tissues. (C) The 5-year survival rate of CC patients with high and low hsa_circ_0084927 expression was evaluated with Kaplan-Meier analysis and log rank test. (D) QRT-PCR was utilized to detect hsa_circ_0084927 expression in CC cells (Hela, SiHa, CaSki, and C-33A) and End1/E6E7 cells. (E and F) After RNase R treatment, the levels of hsa_circ_0084927 and ESRP1 mRNA were analyzed with qRT-PCR. *P < 0.05 and n.s.: no significance.
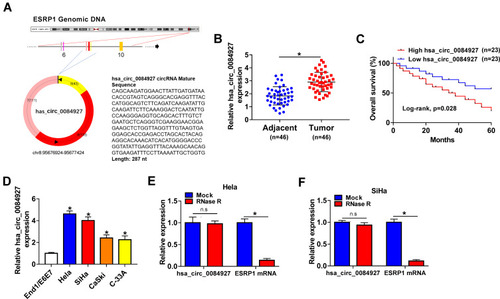
Figure 2 Inhibition of hsa_circ_0084927 decreased the malignancy of CC cells. (A and B) The expression of hsa_circ_0084927 in Hela and SiHa cells after si-circRNA#1, si-circRNA#2, si-circRNA#3, or si-NC transfection was assessed by qRT-PCR. (C-P) Hela and SiHa cells were transfected with si-circRNA#1, si-circRNA#2, or si-NC. (C-M) The proliferation, colony formation, cell cycle progression, apoptosis, migration, and invasion of Hela and SiHa cells were determined with CCK-8, plate clone, flow cytometry, or transwell assays. (N-P) The levels of cyclin D1, c-caspase 3, MMP-2, and MMP-9 in Hela and SiHa cells were measured by Western blotting. *P < 0.05.
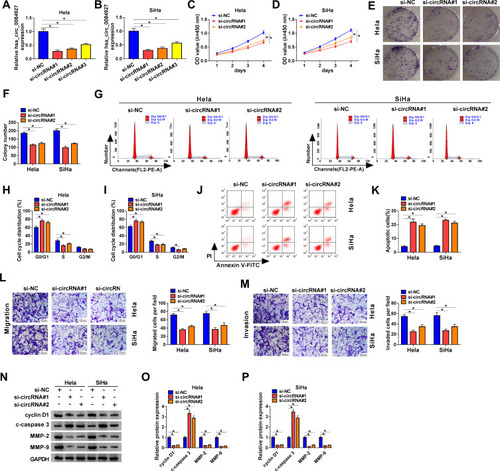
Figure 3 Hsa_circ_0084927 served as a sponge for miR-634, which targeted TPD52 in CC cells. (A and B) Schematic diagrams exhibiting the potential binding sites of hsa_circ_0084927 or TPD52 and miR-634. (C-F) Dual-luciferase reporter assay was performed to analyze the luciferase activity in Hela and SiHa cells cotransfected with NC mimics or miR-634 mimics and luciferase vectors containing hsa_circ_0084927, mut-hsa_circ_0084927, TPD52 3ʹUTR, or mut-TPD52 3ʹUTR. (G and H) RIP assay was performed to determine whether hsa_circ_0084927 could bind miR-634 in Hela and SiHa cells. (I-K) The levels of miR-634, TPD52 mRNA, and TPD52 protein in 46 paired CC tissues and adjacent non-tumor tissues were analyzed by qRT-PCR or Western blotting. (L-N) The correlation among hsa_circ_0084927, miR-634, and TPD52 mRNA were assessed with Pearson’s correlation analysis. *P < 0.05.
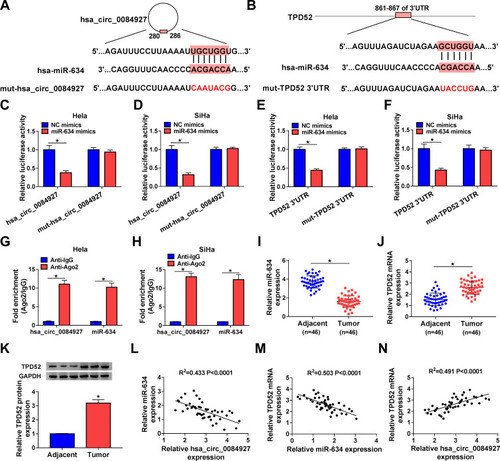
Figure 4 Hsa_circ_0084927 regulated TPD52 expression via miR-634 in CC cells. (A-C) QRT-PCR and Western blotting were performed to examine the levels of miR-634, TPD52 mRNA, and TPD52 protein in CC cells (Hela, SiHa, CaSki, and C-33A) and End1/E6E7 cells. (D-I) QRT-PCR and Western blotting were employed to examine the levels of hsa_circ_0084927, miR-634, TPD52 mRNA, and TPD52 protein in Hela and SiHa cells transfected with si-NC, si-circRNA#1, pCD-ciR, or hsa_circ_0084927. (J-O) QRT-PCR and Western blotting were executed to analyze the levels of miR-634, TPD52 mRNA, and TPD52 protein in Hela and SiHa cells transfected with NC mimics, miR-634 mimics, NC inhibitor, or miR-634 inhibitor. *P < 0.05.
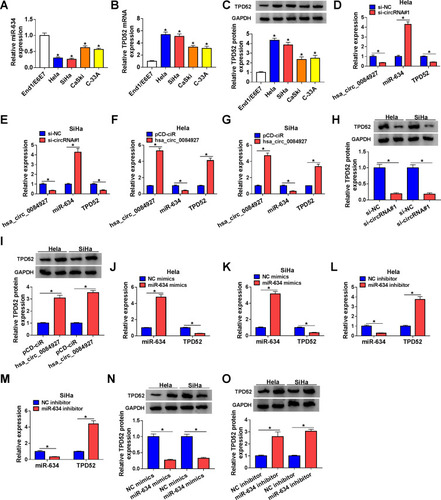
Figure 5 MiR-634 exerted its role through targeting TPD52 in CC cells. (A-N) Hela and SiHa cells were transfected with NC mimics, miR-634 mimics, miR-634 mimics+pcDNA, or miR-634 mimics+TPD52. (A-D) QRT-PCR and Western blotting were conducted to analyze the levels of TPD52 mRNA and protein in Hela and SiHa cells. (E-L) CCK-8, plate clone, flow cytometry, and transwell assays were executed to evaluate the proliferation, colony formation, cell cycle progression, apoptosis, migration, or invasion of Hela and SiHa cells. (M and N) Western blotting was performed to assess the levels of cyclin D1, c-caspase 3, MMP-2, and MMP-9 in Hela and SiHa cells. *P < 0.05.
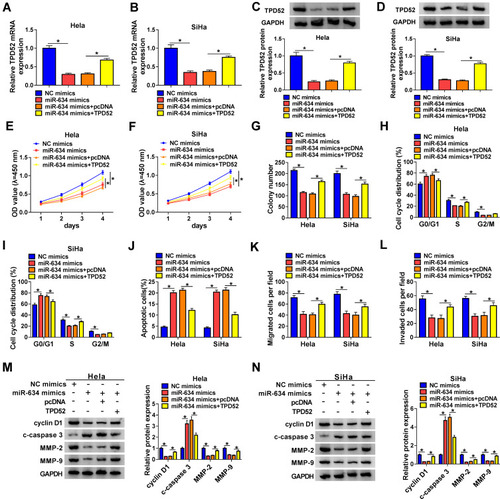
Figure 6 Hsa_circ_0084927 regulated the malignancy of CC cells through miR-634. (A-L) Hela and SiHa cells were transfected with si-NC, si-circRNA#1, si-circRNA#1+NC inhibitor, or si-circRNA#1+miR-634 inhibitor. (A and B) Expression of miR-634 in Hela and SiHa cells were examined with qRT-PCR. (C-J) CCK-8, plate clone, flow cytometry, and transwell assays were performed to determine the proliferation, colony formation, cell cycle progression, apoptosis, migration, or invasion of Hela and SiHa cells. (K and L) The levels of cyclin D1, c-caspase 3, MMP-2, and MMP-9 in Hela and SiHa cells were measured with Western blotting. *P < 0.05.
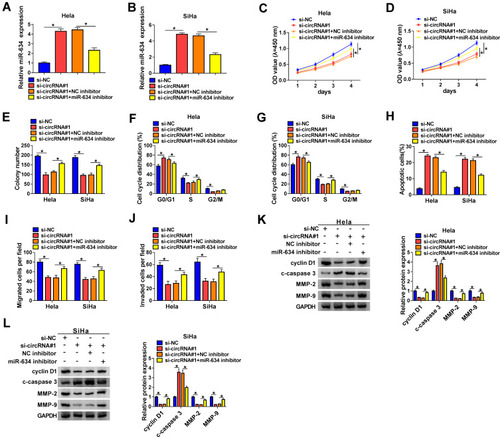
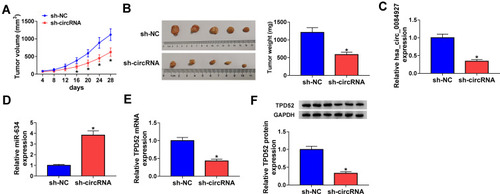
Figure 7 Hsa_circ_0084927 knockdown could reduce tumor growth in vivo. (A and B) In comparison to the sh-NC group, tumor volume and weight were reduced in hsa_circ_0084927-inhibited nude mice. (C-E) Hsa_circ_0084927, miR-634, and TPD52 mRNA levels were examined with qRT-PCR in mice tumor tissues. (F) TPD52 protein level was detected by Western blotting in mice tumor tissues. *P < 0.05.