Figures & data
Figure 1 Circ_0031242 was overexpressed and associated with DDP resistance in HCC. The expression of circ_0031242 by qRT-PCR in 30 healthy hepatic tissues, HCC tissues from 30 primary patients (DDP-sensitive) and 30 recurrent patients after treatment with DDP-based chemotherapy (DDP-resistant) (A), THLE-2, Huh7, SNU-387, Huh7-R and SNU-387-R cells (B). (C) The IC50 value of DDP by CCK-8 assay in Huh7, SNU-387, Huh7-R and SNU-387-R cells. *P < 0.05 by a two-tailed Student’s t-test or ANOVA followed by Tukey-Kramer post hoc test.
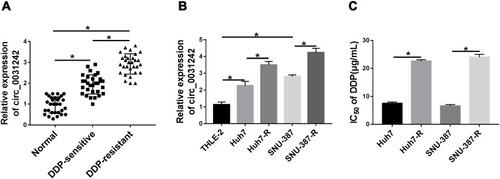
Figure 2 Circ_0031242 knockdown declined DDP resistance, cell viability, migration, invasion and accelerated apoptosis in Huh7-R and SNU-387-R cells. Huh7-R and SNU-387-R cells were transfected with si-NC or si-circ_0031242. (A) Circ_0031242 expression by qRT-PCR in transfected cells. (B) The IC50 value of DDP in transfected cells by CCK-8 assay. (C) Cell viability by CCK-8 assay. (D and E) Cell migration and invasion by transwell assay. (F) Cell apoptosis by flow cytometry. (G) The levels of MRP1 and P-gp in transfected cells by Western blot. *P < 0.05 by a two-tailed Student’s t-test.
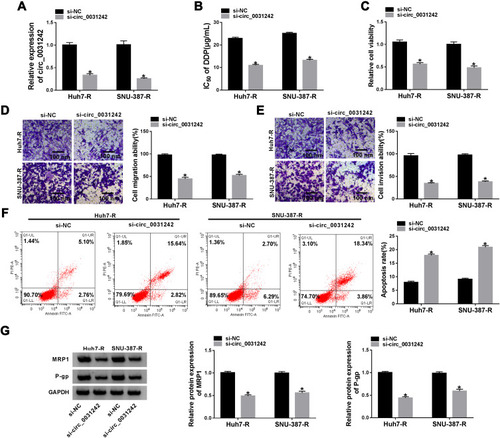
Figure 3 Circ_0031242 knockdown enhanced DDP resistance of Huh7-R cells in vivo. Representative pictures after 4 weeks implantation (A) and growth curves (B) of the xenograft tumors formed by sh-NC-infected, sh-circ_0031242-transduced or un-transduced Huh7-R cells under DDP or PBS treatment. Tumor average weight (C) and circ_0031242 level by qRT-PCR (D) of xenograft tumors formed by sh-NC-infected, sh-circ_0031242-transduced or untransduced Huh7-R cells under DDP or PBS treatment, on 4 weeks after implantation. *P < 0.05 by ANOVA followed by Tukey-Kramer post hoc test.
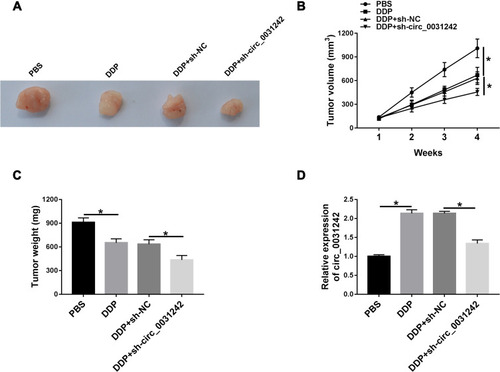
Figure 4 Circ_0031242 directly interacted with miR-924 through pairing to miR-924. (A) Schematic of the putative miR-924-pairing sites within circ_0031242 identified by CircInteractome online tool and the mutation in the target region. (B and C) Relative luciferase activity in Huh7-R and SNU-387-R cells cotransfected with circ_0031242 wild-type (circ_0031242 WT) or mutant-type (circ_0031242 MUT) luciferase reporter constructs and miR-924 mimic or miRNA NC mimic. (D and E) The enrichment levels of circ_0031242 and miR-924 in cell lysates incubated with anti-Ago2 or anti-IgG antibody. The expression of miR-924 by qRT-PCR in 30 healthy hepatic tissues, HCC tissues from 30 primary patients (DDP-sensitive) and 30 recurrent patients after treatment with DDP-based chemotherapy (DDP-resistant) (F), THLE-2, Huh7, SNU-387, Huh7-R and SNU-387-R cells (G), Huh7-R and SNU-387-R cells transfected with inhibitor NC or miR-924 inhibitor (H), Huh7-R and SNU-387-R cells transfected with si-NC, si-circ_0031242, si-circ_0031242+inhibitor NC or si-circ_0031242+miR-924 inhibitor (I). *P < 0.05 by a two-tailed Student’s t-test or ANOVA followed by Tukey-Kramer post hoc test.
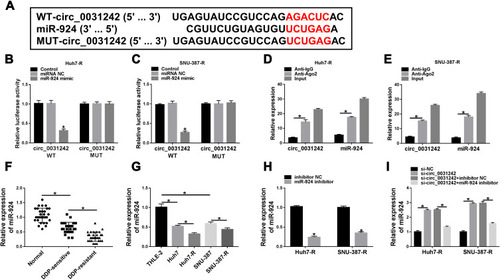
Figure 5 The regulatory impact of circ_0031242 silencing on DDP-resistant HCC cell behaviors was abated by miR-924 down-regulation. Huh7-R and SNU-387-R cells were transfected with si-NC, si-circ_0031242, si-circ_0031242+inhibitor NC or si-circ_0031242+miR-924 inhibitor, followed by the measurement of IC50 value of DDP by CCK-8 assay (A), cell viability by CCK-8 assay (B), cell migration and invasion by transwell assay (C and D), cell apoptosis by flow cytometry (E), MRP1 and P-gp levels by Western blot (F). *P < 0.05 by ANOVA followed by Tukey-Kramer post hoc test.
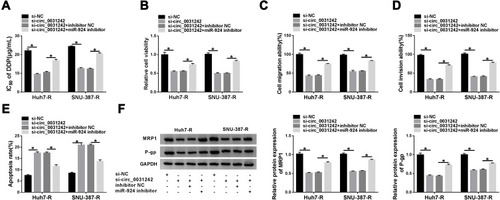
Figure 6 POU3F2 was directly targeted by miR-924. (A) Schematic of the miR-924-pairing sequence within the 3ʹUTR of POU3F2 mRNA and mutated the miR-924-pairing sites. (B and C) Relative luciferase activity in Huh7-R and SNU-387-R cells cotransfected with POU3F2 3ʹUTR wild-type (POU3F2-3ʹUTR WT) or mutant-type (POU3F2-3ʹUTR MUT) luciferase reporter construct and miR-924 mimic or miRNA NC mimic. POU3F2 mRNA and protein levels by qRT-PCR and Western blot in healthy hepatic tissues, HCC tissues from primary patients (DDP-sensitive) and recurrent patients after treatment with DDP-based chemotherapy (DDP-resistant) (D and E), THLE-2, Huh7, SNU-387, Huh7-R and SNU-387-R cells (F), Huh7-R and SNU-387-R cells transfected with pc-POU3F2 or pc-NC (G), Huh7-R and SNU-387-R cells transfected with miRNA NC mimic, miR-924 mimic, miR-924 mimic+pc-NC or miR-924 mimic+pc-POU3F2 (H). *P < 0.05 by a two-tailed Student’s t-test or ANOVA followed by Tukey-Kramer post hoc test.
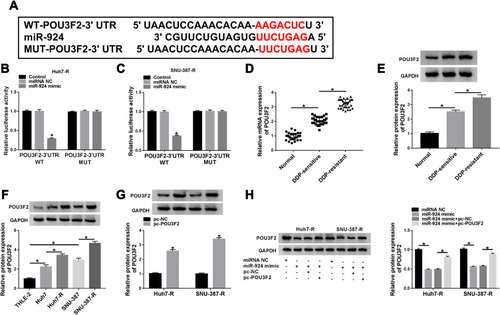
Figure 7 The increased miR-924 level regulated DDP-resistant HCC cell behaviors by down-regulating POU3F2. Huh7-R and SNU-387-R cells were transfected with miRNA NC mimic, miR-924 mimic, miR-924 mimic+pc-NC or miR-924 mimic+pc-POU3F2 (POU3F2 overexpressing plasmid). (A) The IC50 value of DDP in transfected cells by CCK-8 assay. (B) Cell viability by CCK-8 assay. (C and D) Cell migration and invasion by transwell assay. (E) Cell apoptosis by flow cytometry. (F) The levels of MRP1 and P-gp in transfected cells by Western blot. *P < 0.05 by ANOVA followed by Tukey-Kramer post hoc test.
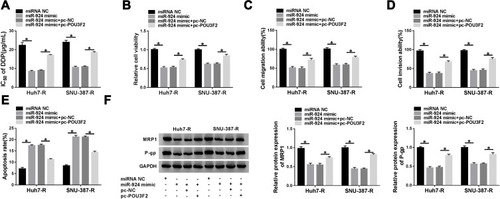
Figure 8 Circ_0031242 regulated POU3F2 expression by sponging miR-924. POU3F2 protein expression by Western blot in Huh7-R and SNU-387-R cells transfected with si-NC, si-circ_0031242, si-circ_0031242+inhibitor NC or si-circ_0031242+miR-924 inhibitor. *P < 0.05 by ANOVA followed by Tukey-Kramer post hoc test.
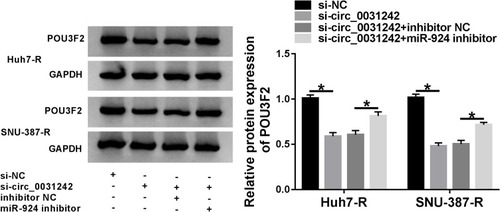
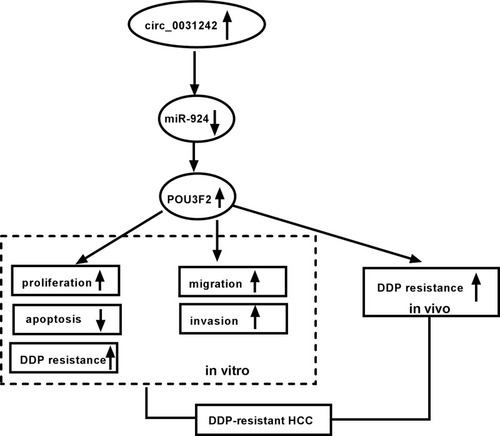
Figure 9 The schematic model of the circ_0031242/miR-924/POU3F2 axis on DDP-resistant HCC cell progression and drug resistance. In DDP-resistant HCC tissues and cells, circ_0031242 was up-regulated, resulting in decreased miR-924. Then, the reduced miR-924 level elevated POU3F2 expression. Finally, the increased expression of POU3F2 enhanced DDP resistance, promoted cell viability, migration, invasion, as well as repressed apoptosis in DDP-resistant HCC cells, thereby leading to DDP-resistant HCC progression.