Figures & data
Figure 1 The expression of circ_0004771 and DDAH1 is elevated in BC. (A–C) qRT-PCR and Western blot analysis of circ_0004771 and DDAH1 expression in BC tissues and matched normal tissues. (D) Correlation analysis of circ_0004771 and DDAH1 expression in BC tissues. (E–G) qRT-PCR and Western blot analysis of circ_0004771 and DDAH1 expression in BC cells (T47D and MB231) and MCF-10A nonmalignant breast epithelial cells. *P<0.05.
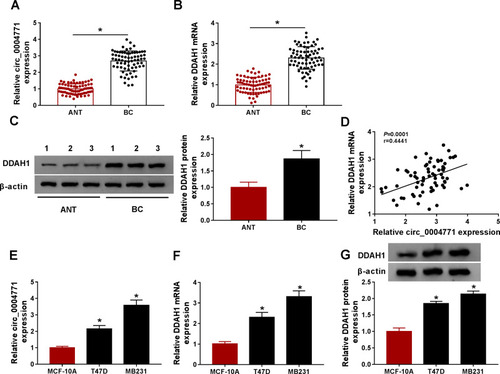
Figure 2 Knockdown of circ_0004771 suppresses cell oncogenic phenotypes in BC. T47D and MB231 cells were transfected with si-circ_0004771 (si-circ#1, si-circ#2, and si-circ#3) or si-NC. (A, B) qRT-PCR analysis of circ_0004771 expression in cells after transfection. (C) Cell proliferation analysis using CCK-8 assay. (D) Apoptosis analysis of cells using flow cytometry. (E) Detection of caspase3 activity in cells using a colorimetric assay kit. (F) Cell adhesion ability analysis using cell adhesion assay. (G, H) Analysis of cell migration and invasion with transwell assay. (I) Western blot analysis of E-cadherin and vimentin levels in cells. *P<0.05.
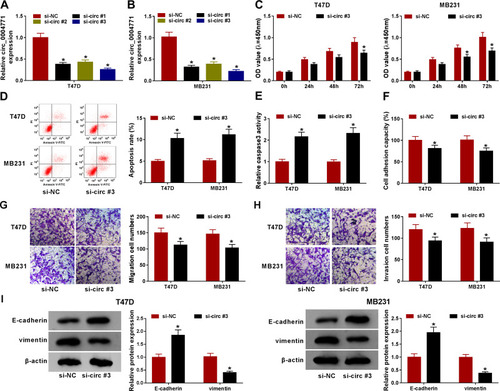
Figure 3 Circ_0004771 regulates cell oncogenic phenotypes in BC via DDAH1. (A) Western blot analysis of DDAH1 expression in cells transfected with si-DDAH1 (si-DDAH1#1, si-DDAH1#2, si-DDAH1#3) or si-NC. (B) qRT-PCR analysis of circ_0004771 expression in cells transfected with vector or circ_0004771. T47D and MB231 cells were transfected with si-NC, si-DDAH1#1, si-DDAH1#1 + vector, or si-DDAH1#1 + circ_0004771. After transfection, (C) CCK-8 assay of cell proliferation analysis; (D) flow cytometry of cell apoptosis analysis; (E) analysis of caspase3 activity in cells using a colorimetric assay kit; (F) cell adhesion ability analysis using cell adhesion assay; (G, H) transwell assay of cell migration and invasion abilities analyses; (I) Western blot analysis of E-cadherin and vimentin levels in cells. *P<0.05.
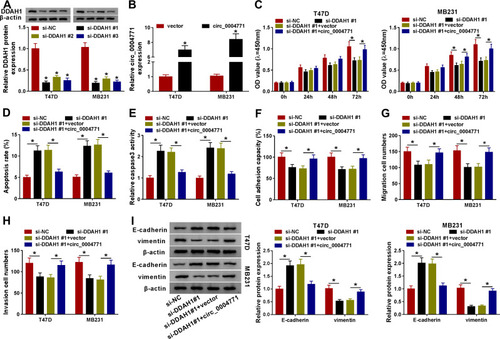
Figure 4 Circ_0004771 is a sponge of miR-1253. (A) The predicted binding sites of miR-1253 on circ_0004771 sequences. (B) Luciferase activity of T47D and MB231 cells co-transfected with the reporter plasmids and the indicated miRNAs was detected by dual-luciferase reporter assay. (C) qRT-PCR analysis of circ_0004771 expression in T47D and MB231 cells after Bio-miR-1253 pull-down assay. (D) qRT-PCR analysis of circ_0004771 and miR-1253 expression isolated from Ago2 and IgG immunoprecipitates derived from T47D and MB231 cells. (E) qRT-PCR analysis of miR-1253 expression in T47D and MB231 cells transfected with vector, circ_0004771, si-NC, or si-circ#3. *P<0.05.
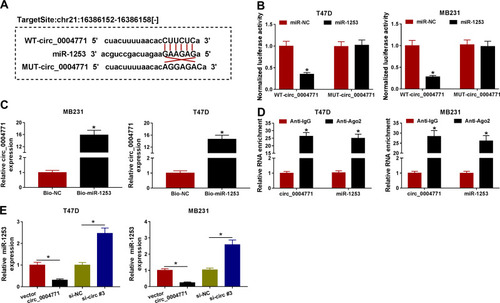
Figure 5 DDAH1 is a target of miR-1253. (A) The putative binding sites between miR-1253 and DDAH1. (B) Luciferase activity of T47D and MB231 cells co-transfected with the reporter plasmids and the indicated miRNAs was detected by dual-luciferase reporter assay. (C) qRT-PCR analysis of miR-1253 expression in T47D and MB231 cells transfected with anti-NC or anti-miR-1253. (D) Western blot analysis of DDAH1 level in T47D and MB231 cells transfected with miR-NC, miR-1253, anti-NC, or anti-miR-1253. *P<0.05.
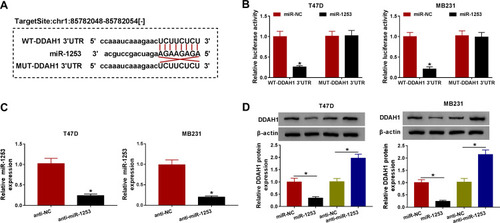
Figure 6 Circ_0004771 regulates DDAH1 expression via miR-1253. (A, B) Western blot analysis of DDAH1 expression in T47D and MB231 cells transfected with si-NC, si-circ#3, si-circ#3 + anti-NC or si-circ#3 + anti-miR-1253. *P<0.05.
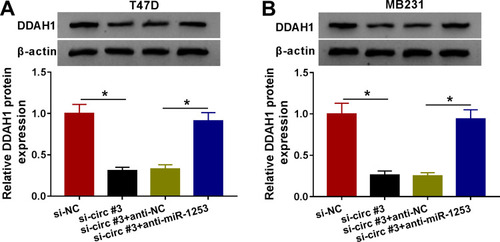
Figure 7 Circ_0004771 hinders BC tumor growth and EMT in vivo. (A, B) Measurement of the size and weight of xenograft tumors. (C, D) qRT-PCR analysis of circ_0004771 and miR-1253 levels in tumor masses from each group. (E) Western blot analysis of DDAH1, E-cadherin and vimentin protein levels in tumor masses. *P<0.05.
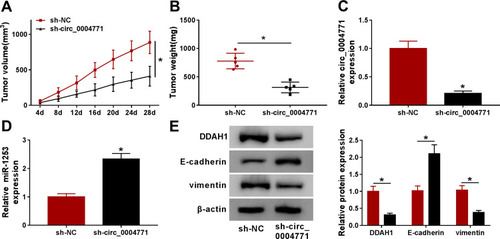
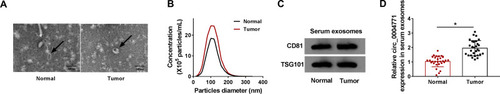
Figure 8 Circ_0004771 is packaged into exosomes derived from the serum of BC. (A) TEM images of exosomes (arrow pointed). (B) NTA of the diameters of exosomes. (C) Western blot analyses of exosomal markers (CD81 and TSG101). (D) qRT-PCR analysis of circ_0004771 expression in serum exosomes from BC patients. *P<0.05.