Figures & data
Table 1 Clinicopathological Characteristics of All Patients
Table 2 Univariate and Multivariate Analyses for the Overall Survival of All Patients According to Their Baseline FAR
Figure 1 Kaplan–Meier plot of OS for all patients stratified into two groups: patients with a FAR ≥0.08 and patients with a FAR < 0.08.
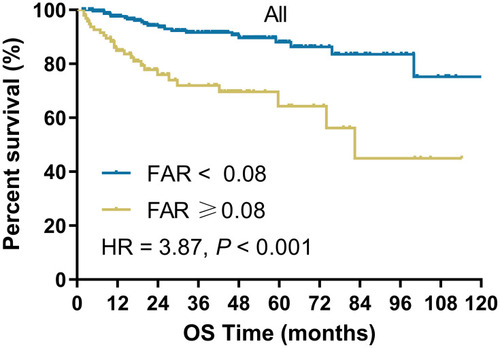
Figure 2 Kaplan–Meier plot of PFS for all patients stratified into two groups: patients with a FAR ≥0.08 and patients with a FAR < 0.08.
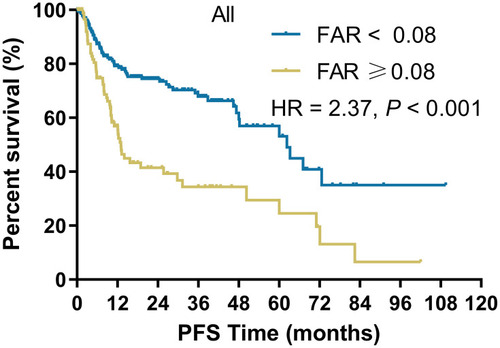
Table 3 Univariate and Multivariate Analyses for the Progression-Free Survival of All Patients According to Their Baseline FAR
Figure 3 Kaplan–Meier plot of OS for patients without radical surgical resection stratified into two groups: patients with a FAR ≥0.08 and patients with a FAR < 0.08.
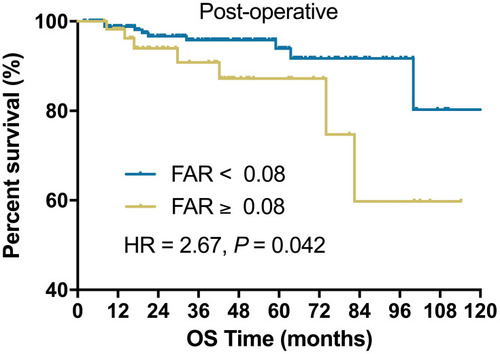
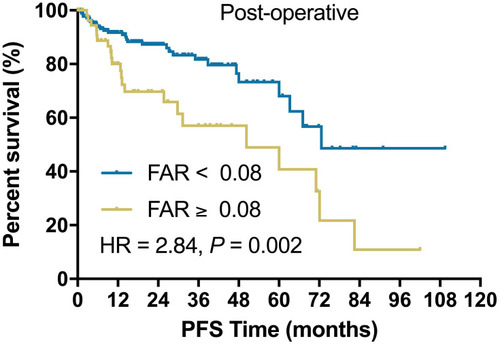
Figure 4 Kaplan–Meier plot of PFS for patients without radical surgical resection stratified into two groups: patients with a FAR ≥0.08 and patients with a FAR < 0.08.