Figures & data
Table 1 Association of PROX1-AS1 Expression with Clinic-Pathological Features of GC Patients
Figure 1 PROX1-AS1 expression is up-regulated in GC and positively correlates with poor prognosis. (A) The PROX1-AS1 mRNA level in GC tissues and the corresponding normal tissues were detected by RT-qPCR assay. (B) Examination of the correlation between PROX1-AS1 expression and clinical pathological features showed that PROX1-AS1 up-regulation correlated with advanced pathological stage. (C) Kaplan-Meier curves for overall survival analysis based on PROX1-AS1 expression. (D) The expression of PROX1-AS1 was assessed in GC cells. *P < 0.05, **P < 0.01, ***P < 0.001 vs Non-tumor, I+II or GES-1 group.
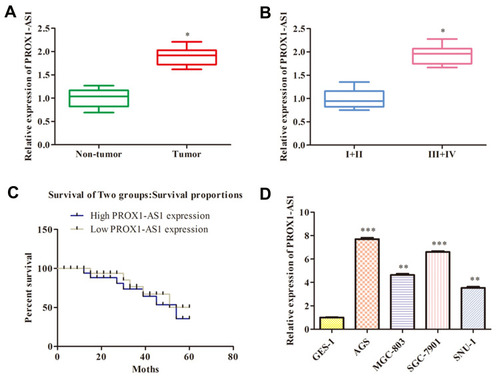
Figure 2 PROX1-AS1 knockdown suppresses the proliferation and promotes apoptosis of GC cells. (A) Transfection efficiency was verified by RT-qPCR analysis. (B) Cell viability was examined by CCK-8 assay. (C) The functional role of PROX1-AS1 on colony formation was analyzed by colony formation assay (magnification, 40×). (D) Cell cycle was assessed by flow cytometry assay. (E) The expression of cell cycle regulatory proteins was analyzed using Western blot. (F) Cell apoptosis was assessed by flow cytometry assay. (G) The expression of cell apoptosis regulatory proteins was analyzed using Western blot. *P < 0.05, **P < 0.01, ***P < 0.001 vs sh-NC group.
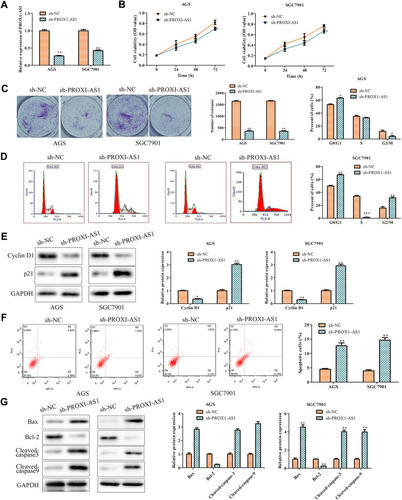
Figure 3 Inhibition of PROX1-AS1 suppresses the migration and invasion of GC cells. (A, B) The wound-healing assay and transwell chamber assays were used to assess cell migration and invasion. (C) The protein expression levels of MMP-2 and MMP-9 in AGS and SGC7901 cells. **P < 0.01 vs sh-NC group.
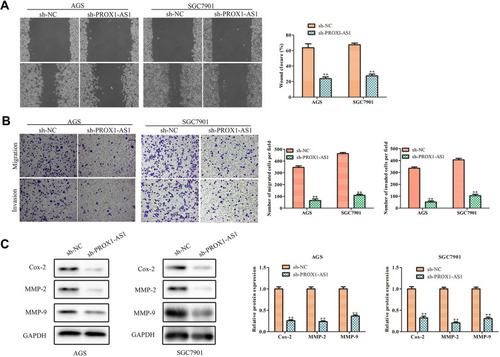
Figure 4 PROX1-AS1 acts as a molecular sponge for miR-877-5p. (A) The subcellular location analysis of PROX1-AS1. (B) Putative binding regions of PROX1-AS1 in miR-877-5p predicted by StarBase. (C) Luciferase reporter assay was conducted to verify the relationship between PROX1-AS1 and miR-877-5p. (D) RT-qPCR was used to detect miR-877-5p expression level after sh-PROX1-AS1 treatments. (E, F) The mRNA expression of miR-877-5p in GC tissues and cell lines were analyzed by RT-qPCR. (G) Pearson’s correlation analysis between PROX1-AS1 and miR-877-5p expression. *P < 0.05 vs Cytoplasmic, NC mimics, Non-tumor, or GES-1 group.
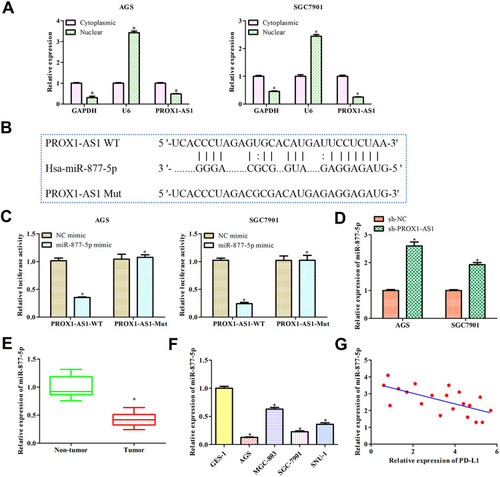
Figure 5 Overexpression of miR-877-5p inhibits GC progression. (A) RT-qPCR was used to detect the transfection efficiency of miR-877-5p mimic. (B) Cell viability was examined by CCK-8 assay. (C) The functional role of miR-1303 on colony formation was analyzed by colony formation assay (magnification, 40×). (D) Cell apoptosis was assessed by flow cytometry assay. (E) The effects of miR-877-5p on cell migration and invasion were measured by transwell assay (magnification, 200×). *P < 0.05, **P < 0.01, ***P < 0.001 vs NC mimic group.
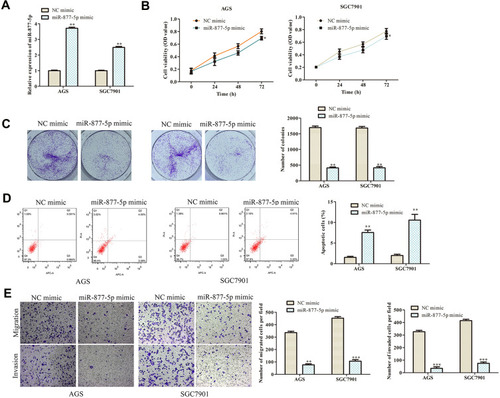
Figure 6 PD-L1 is target gene of miR-877-5p. (A) The predicted binding site of miR-877-5p in the 3ʹ-UTR of PD-L1. (B) The relative luciferase activity was detected. (C, D) Relative expression of PD-L1 was examined by RT-qPCR and Western blot assay. **P < 0.01 vs NC mimic. (E, F) The mRNA expression of PD-L1 in GC tissues and cell lines were analyzed by RT-qPCR. (G) Pearson’s correlation analysis between miR-877-5p and PD-L1 expression. *P < 0.05, **P < 0.01, ***P < 0.001 vs NC mimics, Non-tumor, or GES-1 group.
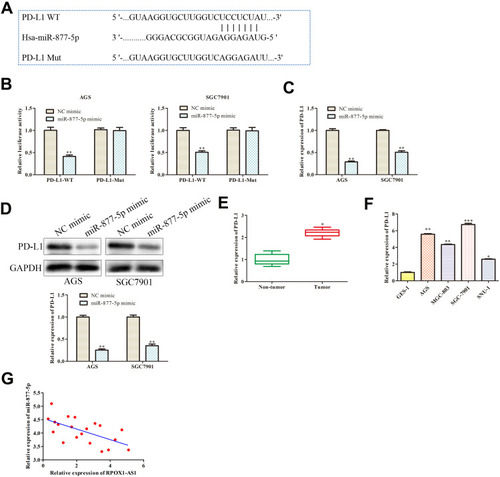
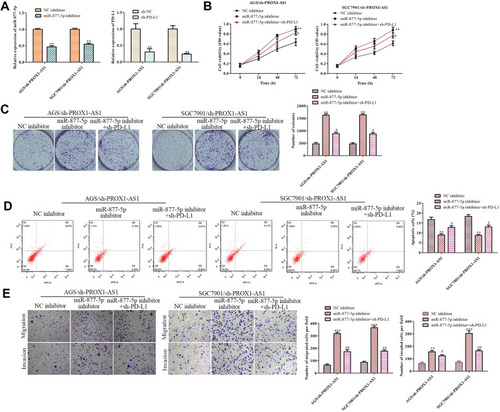
Figure 7 PROX1-AS1 promotes cell growth, invasion and inhibits apoptosis by targeting miR-877-5p/PD-L1 axis. (A) The RT-qPCR assay was implemented to certify transfection efficiency for miR-877-5p inhibitor and sh-PD-L1. (B–E) CCK-8, colony formation, flow cytometry, and transwell assays were employed to estimate the role of PROX1-AS1/miR-877-5p/PD-L1 axis in GC cell proliferation, migration, invasion and apoptosis. **P < 0.01, ***P < 0.001 vs NC inhibitor group. #P < 0.01, ##P < 0.05 vs miR-877-5p inhibitor group.