Figures & data
Table 1 Expression Patterns of LMNB1 in LUAD Tissues and Normal Tissues Revealed in Immunohistochemistry Analysis
Table 2 Relationship Between LMNB1 Expression and Tumor Characteristics in Patients with LUAD
Table 3 Relationship Between LMNB1 Expression and Tumor Characteristics in Patients with LUAD Analyzed by Spearman Rank Correlation Analysis
Figure 1 Identification of LMNB1 as potential tumor promotor in LUAD. (A) RNA-seq was performed to identify differentially expressed genes (DEGs) in LUAD tumor tissues and normal tissues. (B) Endogenous expression of several selected DEGs was detected by qPCR in NCI-H1299 cells. (C) Celigo cell counting assay was utilized to evaluate the inhibition of cell proliferation by knockdown of the selected DEGs. (D, E) The expression of LMNB1 in LUAD tumor tissues and normal tissues was detected by qPCR (D) and immunohistochemistry analysis (E). (F) Kaplan–Meier survival analysis was performed to show the correlation between LMNB1 expression and prognosis of LUAD patients. *P<0.001.
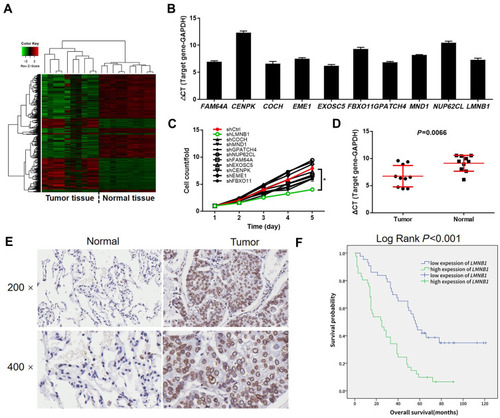
Figure 2 Depletion of LMNB1 inhibits cell proliferation and migration, induces cell apoptosis and cell cycle arrest. (A) qPCR and Western blotting were performed to assess the knockdown efficiency of LMNB1 in LUAD cells. (B) Effects of LMNB1 knockdown on cell proliferation was determined by Celigo cell counting assay. (C, D) Influence of LMNB1 depletion on cell apoptosis and cell cycle distribution was detected by flow cytometry. (E, F) Impacts of LMNB1 knockdown on LUAD cell migration was examined by wound-healing (E) and transwell (F) assays. *P<0.05, **P<0.01, ***P<0.001.
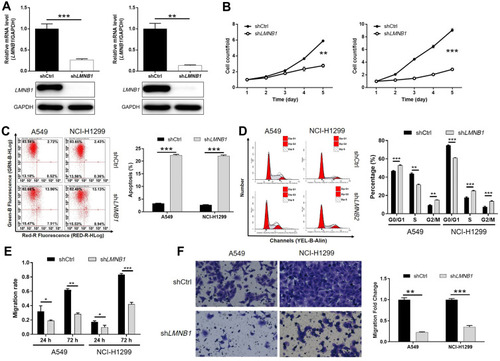
Figure 3 Exploration of mechanism by which LMNB1 regulates LUAD. (A, B) Human apoptosis antibody array was performed to identify differentially expressed apoptosis-related proteins in NCI-H1299 cells with or without LMNB1 knockdown. (C) Western blotting was performed to detect the changes in expression of proteins in cancer-related signaling pathways. *P<0.05, **P<0.01.
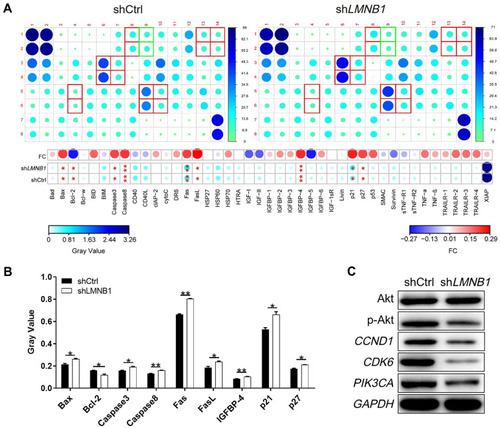
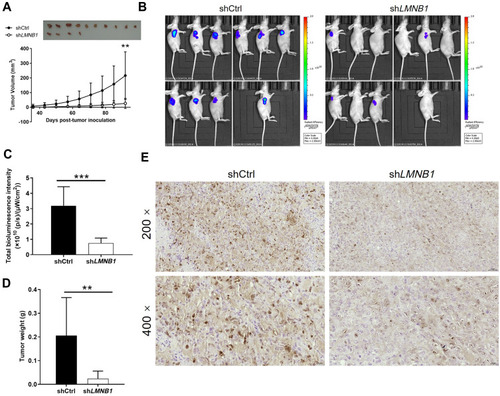
Figure 4 LMNB1 knockdown reduces tumorigenesis of LUAD cells in vivo. (A) Tumor volume was calculated based on tumor size measured at indicated time intervals. Inset: photo of the removed xenografts. (B) In vivo imaging was performed to evaluate tumor growth. (C) The total intensity of bioluminescence was scanned to represent the tumor burden. (D) Tumor weight was measured after sacrificing mice. (E) The expression of Ki67 in tumor sections was detected by immunohistochemistry analysis. *P<0.01, **P<0.001.