Figures & data
Figure 1 The protocol for establishing the mini-PDX models. Ovarian cancer cells were collected and transferred to capsules that had been washed in HBSS (Hank’s Balanced Salt Solution). The capsules were subsequently implanted subcutaneously into BALB/c nude mice. Four to six chemotherapy regimens (and normal saline as a control) were then used to treat the mice. After 7 days of treatment, the capsules were removed and analyzed by the OncoVee® MiniPDX Assay for the rapid systemic detection of drug sensitivity.
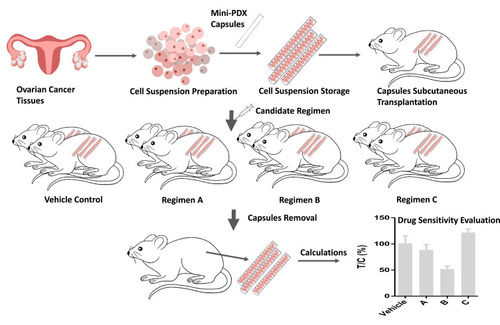
Table 1 Baseline Patient Characteristics
Table 2 Medical History of the Patients Included in This Study
Table 3 CtDNA Results for the 12 Patients
Table 4 Mini-PDX Drug Sensitivity Results for the 12 Patients
Figure 2 Mini-PDX models demonstrated that the expression levels of IHC markers were consistent with epithelial ovarian cancer tissues (pKi67, MUC16, and WT1 positive).
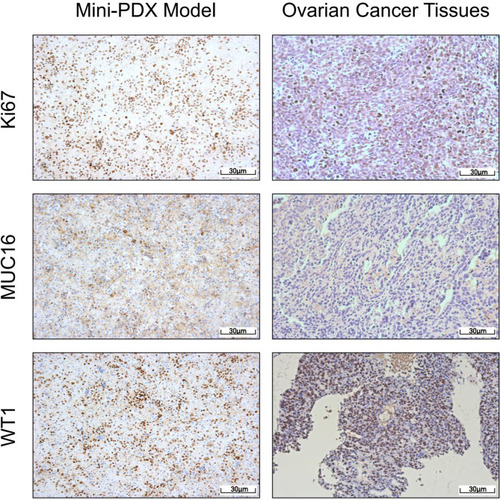
Figure 3 Continued.
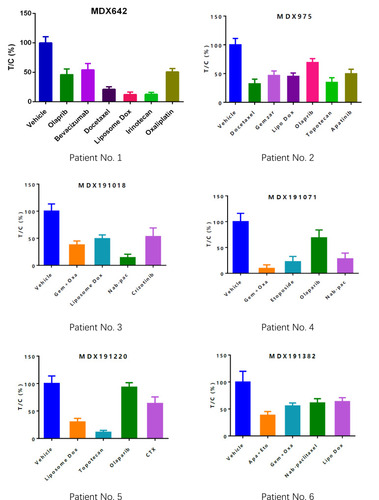
Figure 3 Drug-selection test results for the mini-PDX models based on the 12 patients. Tumor cell growth (T/C% = treatment group proliferation rate/control group proliferation rate%) was calculated using the formula: (mean RLU of the treatment group on day 7 - mean RLU on day 0)/(mean RLU of the vehicle group on day 7 - mean RLU on day 0). Abbreviations for chemotherapy: Liposomal doxorubicin (Lipo Dox); Nab-pac (Nab-paclitaxel); Gem+Oxa (Gemcitabine+Oxaliplatin); CTX (Cyclophosphamide); Apa+Eto (Apatinib+Etoposide); Doc+Carbo (Docetaxel+Carboplatin); Bev+CTX (Bevacizumab+Cyclophosphamide); Gemzar (Gemcitabine).
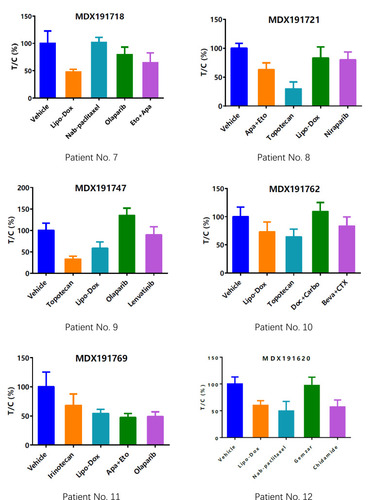
Table 5 Treatment After Enrollment, Clinical Response, and Side Effects
Figure 4 Distribution of treatment outcomes, including the treatment outcomes of targeted lesions (A), non-targeted lesions (B), and overall outcomes (C). The outcomes of treatment were defined according to the RECIST1.1 standard. The overall clinical-benefit rate was 75%.
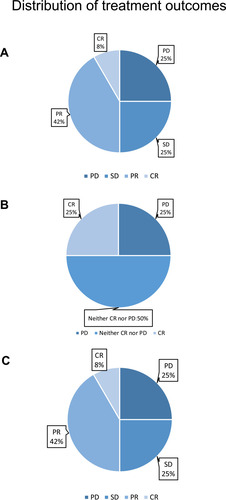
Figure 5 The loss of weight in mice during the 7 days of drug treatment. RCBW% = (BWi-BW0)/BW0*100%; BWi represents the body weight of the mice on day1 while BW0 represents the body weight of mice when the mini-PDX model was first established. Abbreviations for chemotherapy: Liposomal doxorubicin (Lipo Dox); Nab-pac (Nab-paclitaxel); Gem+Oxa (Gemcitabine+Oxaliplatin); CTX (Cyclophosphamide); Apa+Eto (Apatinib+Etoposide); Doc+Carbo (Docetaxel+Carboplatin); Bev+CTX (Bevacizumab+Cyclophosphamide); Gemzar (Gemcitabine).
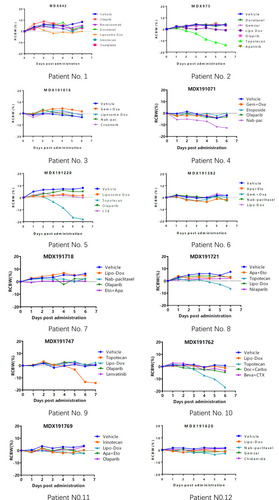
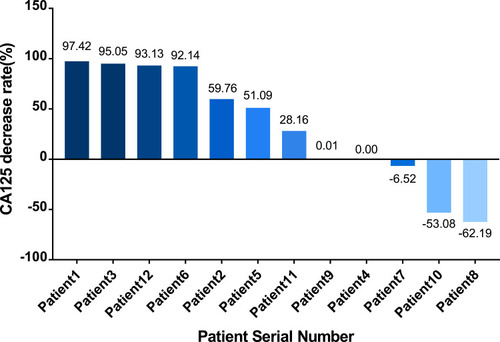
Figure 6 The rate of CA125 reduction in the 12 patients. The Y axis shows the rate of reduction in CA125, as calculated by the following formula: (CA125 level after all cycles with the observed CA125 level prior to the first cycle of the observed regimen)/CA125 level prior to the first cycle of the observed regimen*100%). This rate was a negative number when the level of CA125 increased after treatment. The X axis represents the 12 patients ranked from the highest to the lowest (negative) rate of CA125 reduction.