Figures & data
Table 1 Basic Characteristics of HCC Patients Stratified According to Levels of the PALBI
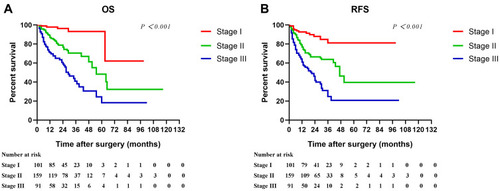
Figure 1 Kaplan–Meier cumulative overall survival (A) and recurrence-free survival (B) curves of the study population, and overall survival and recurrence-free survival curves of patients stratified according to BCLC (C–D) and CLIP (E–F) staging systems.
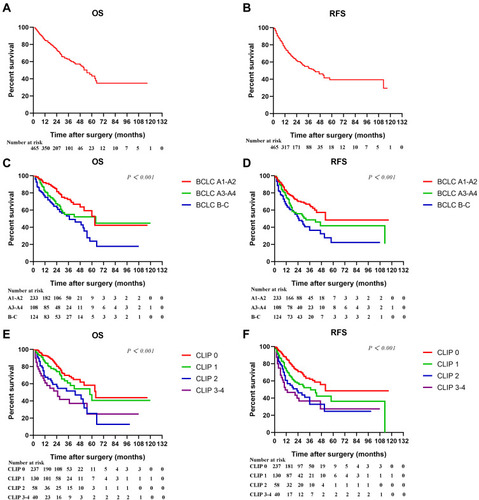
Table 2 Univariate Analysis of Factors Associated with Overall Survival and Recurrence-Free Survival of HCC Patients
Figure 2 Kaplan–Meier cumulative overall survival and recurrence-free survival curves of patients stratified according to ALBI (A–B) and PALBI (C–D).
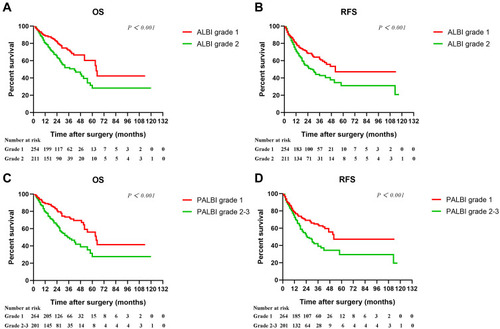
Figure 3 Forest plots based the results of multivariate analysis for overall survival (A) and recurrence-free survival (B).
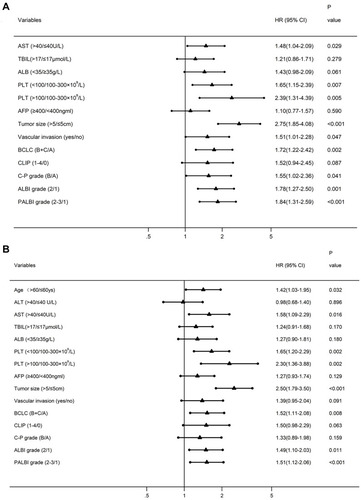
Figure 4 Kaplan–Meier cumulative overall survival and recurrence-free survival curves of patients stratified according to PLT (A–D), PALBI in patients with thrombocytopenia (E–F), and PALBI in patients excluding thrombocytopenia (G–H).
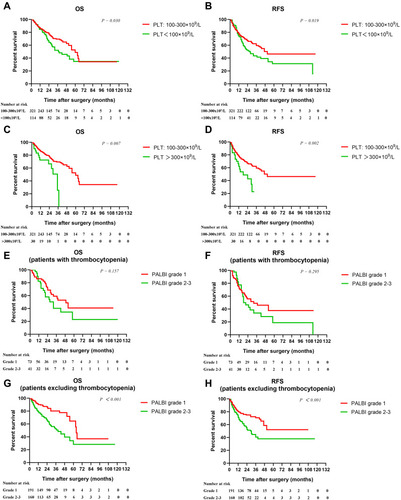
Table 3 Ranking of Discriminatory Ability of the Prognostic Systems on the Basis of the C-Index in All Patients
Table 4 Ranking of Discriminatory Ability of the Prognostic Systems on the Basis of the C-Index in HCC Patients Excluding Thrombocytopenia
Figure 5 Cumulative overall survival and recurrence-free survival curves of patients stratified according to PALBI and tumor size (A–B, Stage I PALBI grade 1 and tumor size ≤5 cm; Stage II: PALBI grade 1 and tumor size >5 cm, or PALBI grade 2–3 and tumor size ≤5 cm; Stage III: PALBI grade 2–3 and tumor size >5 cm) in HCC patients excluding thrombocytopenia.