Figures & data
Figure 1 The expression and circRNA characterization of circGDI2 in OSCC. (A) The exonic information of circGDI2 was presented. (B and C) The expression of circGDI2 in OSCC tumor tissues (Tumor), adjacent normal tissues (Normal), OSCC cells (SCC-15 and HSC-3 cells) and normal HOK cells was measured by qRT-PCR. (D and E) RNase R assay was utilized to evaluate the stability of circGDI2 and GDI2. (F) The overexpression efficiency of oe-circGDI2 in SCC-15 and HSC-3 cells was verified.
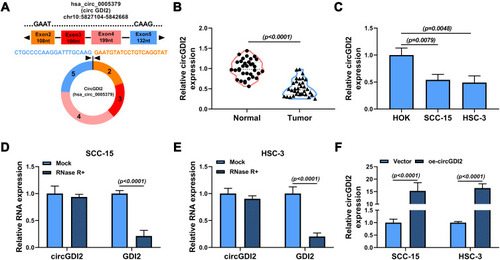
Figure 2 CircGDI2 overexpression impeded cell proliferation, metastasis and accelerated apoptosis in OSCC cells. SCC-15 and HSC-3 cells were transfected with oe-circGDI2 or Vector. (A–C) CCK8 assay and colony formation assay measured cell proliferation. (D) Flow cytometry detected cell apoptosis. (E and F) Transwell assay determined cell migration and invasion.
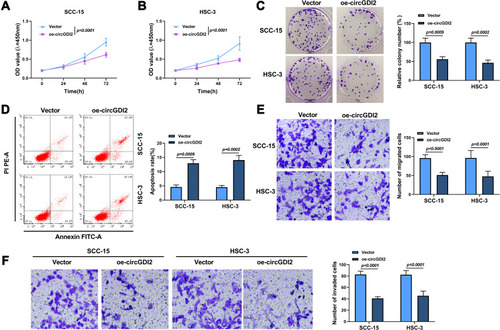
Figure 3 CircGDI2 directly sponged miR-454-3p. (A) The putative binding sites of circGDI2 and miR-454-3p were presented. (B–E) Dual-luciferase reporter assay (B and C) and RIP assay (D and E) were used to verify the interaction between circGDI2 and miR-454-3p. (F and G) QRT-PCR was performed to test the level of miR-454-3p in OSCC tumor tissues and cells and corresponding controls. (H) Pearson correlation analysis was performed to analyze the correlation between circGDI2 and miR-454-3p in OSCC tumor tissues. (I) QRT-PCR determined the expression of miR-454-3p in SCC-15 and HSC-3 cells transfected with oe-circGDI2, oe-circGDI2 + miR-454-3p mimic or corresponding controls.
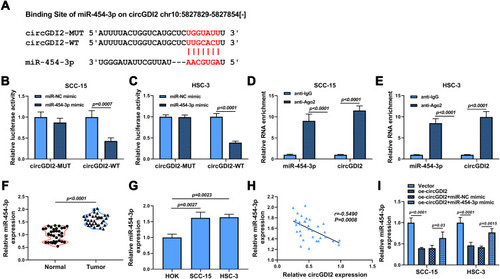
Figure 4 The effect of circGDI2 overexpression on OSCC cell progression was reversed by miR-454-3p introduction. SCC-15 and HSC-3 cells were transfected with oe-circGDI2, oe-circGDI2 + miR-454-3p mimic or corresponding controls. (A–C) Cell proliferation was tested by CCK8 assay and colony formation assay. (D) Cell apoptosis was explored by flow cytometry. (E and F) Cell migration and invasion were detected by Transwell assay.
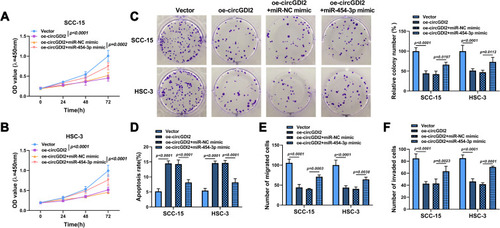
Figure 5 FOXF2 was a target of miR-454-3p. (A) The putative target sequence of miR-454-3p in FOXF2 3ʹUTR was shown. (B–E) The interaction between miR-454-3p and FOXF2 was confirmed by dual-luciferase reporter assay (b and c) and RIP assay (D and E). (F–I) The mRNA and protein expression levels of FOXF2 in OSCC tumor tissues and normal tissues (F and G) as well as OSCC cells and HOK cells (H and I) were determined by qRT-PCR and Western blot. (J) The correlation between miR-454-3p and FOXF2 in OSCC tumor tissues was attested by Pearson correlation analysis. (K) The expression of miR-454-3p in SCC-15 and HSC-3 cells transfected with anti-miR-454-3p or anti-miR-NC was measured by qRT-PCR. (L and M) The mRNA and protein expression levels of FOXF2 in SCC-15 and HSC-3 cells transfected with anti-miR-454-3p, anti-miR-454-3p + si-FOXF2 or corresponding controls were assessed by qRT-PCR and Western blot analysis.
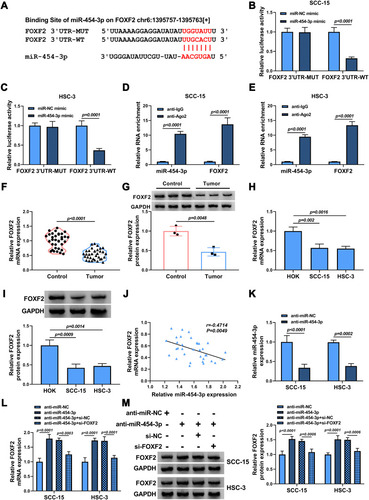
Figure 6 FOXF2 knockdown alleviated the inhibitory effects of anti-miR-454-3p on the progression of OSCC cells. SCC-15 and HSC-3 cells were transfected with anti-miR-NC, anti-miR-454-3p, anti-miR-454-3p + si-NC or anti-miR-454-3p + si-FOXF2. (A–C) Cell proliferation was determined using CCK8 and colony formation assays. (D) Cell apoptosis was explored by flow cytometry. (E and F) Cell migration and invasion was assessed by Transwell assay.
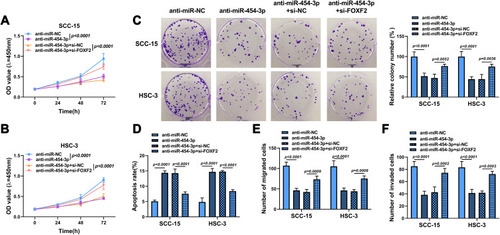
Figure 7 CircGDI2 enhanced FOXF2 expression by targeting miR-454-3p. SCC-15 and HSC-3 cells were transfected with oe-circGDI2, Vector, oe-circGDI2 + miR-454-3p mimic or oe-circGDI2 + miR-NC mimic. (A and B) The mRNA and protein levels of FOXF2 were measured by qRT-PCR and Western blot.
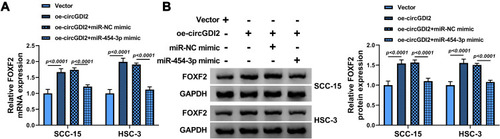
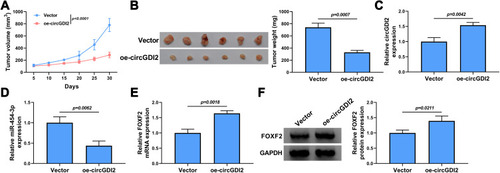
Figure 8 CircGDI2 overexpression impeded OSCC tumor growth in vivo. HSC-3 cells transfected with oe-circGDI2 or Vector were injected into nude mice. Tumor volume (A) and tumor weight (B) of OSCC tumors from tumor-bearing nude mice after transfection in each group were measured. (C and D) The expression levels of circGDI2 and miR-454-3p were determined by qRT-PCR. (E and F) The mRNA and protein expression of FOXF2 was detected by qRT-PCR and Western blot.