Figures & data
Figure 1 CST1 is upregulated in gastric cancer tissues and associated with poor outcome. (A) CST1 was significantly upregulated in gastric cancer tissues compared to normal gastric tissues, data were downloaded from the TCGA dataset. (B) Western blot determined CST1 expression in gastric cancer tissues and adjacent normal gastric tissues, GAPDH was used as the loading control. (C) Survival curves showed patients with high CST1 expression had poor outcome.
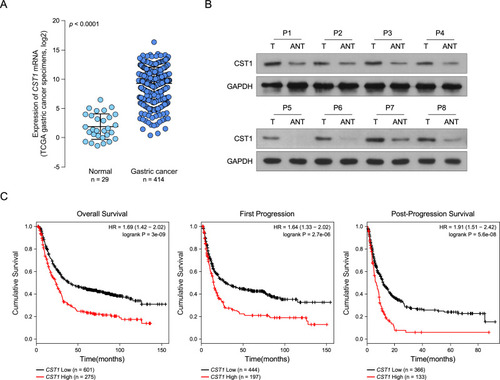
Figure 2 CST1 promotes gastric cancer cell migration and invasion. (A) Q-PCR and Western blot determined CST1 expression in normal gastric cell and gastric cancer cells. (B) Western blot determined the effect of CST1 overexpression and CST1 knockdown, GAPDH was used as the loading control. (C) Transwell chambers assay without Matrigel showed CST1 overexpression promoted cellular migration, while CST1 knockdown inhibited cellular migration. (D) Transwell chambers assay with Matrigel showed CST1 overexpression promoted cellular invasion, while CST1 knockdown inhibited cellular invasion. (E) 3D invasion assay showed CST1 overexpression promoted cellular invasion, while CST1 knockdown inhibited cellular invasion. (F) WB analysis of E-cadherin, α-catenin, fibronectin and vimentin expression after CST1 overexpression or knockdown, GAPDH was used as the loading control. Data were obtained from three independent experiments, and values are presented as the means ± SEM. *P < 0.05.
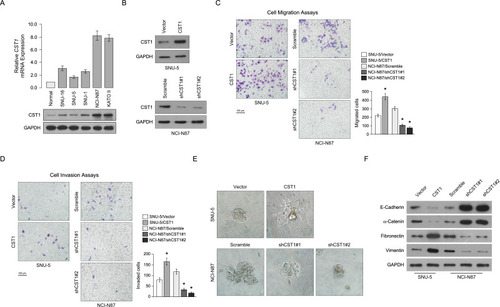
Figure 3 CST1 regulated Wnt pathway. (A) GSEA assay showed CST1 expression was positively correlated with Wnt signaling pathway activity. (B) Luciferase reporter assay showed CST1 overexpression increased Wnt pathway activity, while CST1 knockdown inhibited Wnt pathway activity. (C) Western blot analyzed β-catenin expression in nuclear and cytoplasm after CST1 overexpression or knockdown. (D) Heatmap showed Wnt pathway target genes expression after CST overexpression or knockdown. Data were obtained from three independent experiments, and values are presented as the means ± SEM. *P < 0.05.
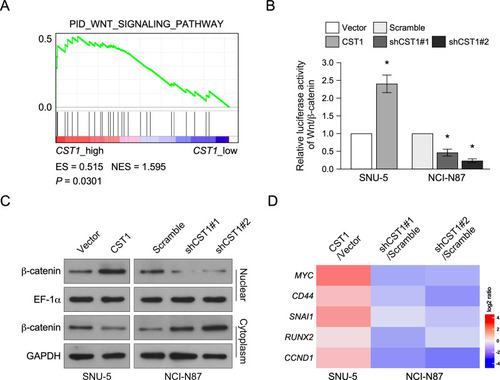
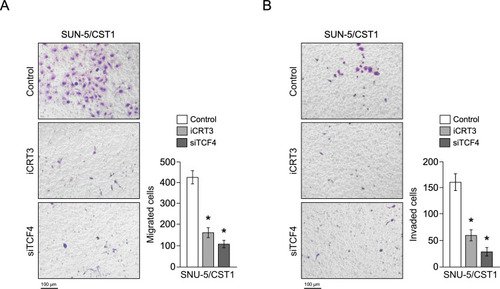
Figure 4 CST1 promoted gastric cancer migration and invasion through activating Wnt pathway. (A) Transwell chambers assay without Matrigel showed inhibition of Wnt pathway in CST1 overexpression cell inhibited cellular migration. (B) Transwell chambers assay with Matrigel showed inhibition of Wnt pathway in CST1 overexpression cell inhibited cellular invasion. Data were obtained from three independent experiments, and values are presented as the means ± SEM. *P < 0.05.