Figures & data
Table 1 Correlation Between ROCK2 Expression and the Clini-Copathological Characteristics of the Osteosarcoma Patients
Figure 1 ROCK2 is upregulated in OS tissue and cells. (A) RT-qPCR analysis of ROCK2 mRNA expression in 30 cases of OS and corresponding adjacent tissues. (B) Analysis of ROCK2 protein expression in OS and corresponding adjacent tissues, as determined via immunoblotting. GAPDH was used as a loading control. (C) Representative images of ROCK2 staining in 43 paired OS tissues (scale bar, 50 μm). (D and E) ROCK2 expression in OS cells (U2-OS, Saos-2, 143B and MG-63) and normal hfoBI-19 cells was detected via RT-qPCR and Western blotting. GAPDH was used as a loading control. *P<0.05, **P<0.01.
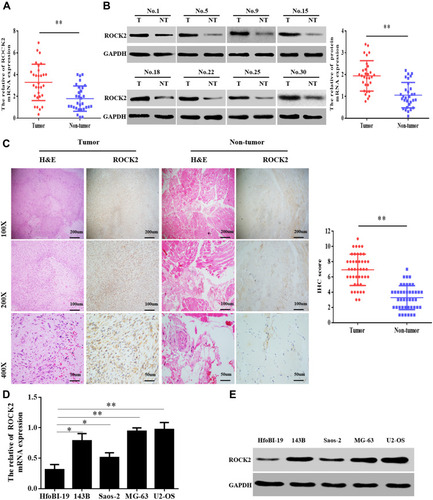
Figure 2 Knockdown of ROCK2 expression inhibits OS growth in vitro and in vivo. (A) mRNA and (B) protein levels of ROCK2 in U2-OS and MG-63 cells following transfection with shROCK2-1, shROCK2-2 and shNC (control) were determined via reverse transcription-quantitative PCR and Western blotting. (C) Cell counting kit 8 and (D) EdU assays demonstrated a decrease in shROCK2-transfected OS cell (U2-OS and MG-63) growth compared with shNC-transfected cells (scale bars:100μM). (E) Representative images of the colony formation assay performed using OS cells transfected with shROCK2 or shNC. (F) Flow cytometry analysis of OS cell apoptosis following ROCK2 silencing. (G–I) shROCK2/U2-OS and shNC/U2-OS cells were subcutaneously injected into nude mice, after which tumour volumes were measured on the indicated days. At the endpoint, tumours were dissected, imaged and weighed (n=5). *P<0.05, **P<0.01 and ***P<0.001.
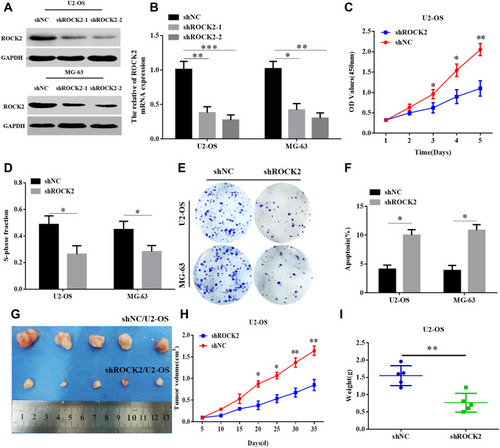
Figure 3 Overexpression of ROCK2 promotes the growth of OS in vitro and in vivo. (A and B) Saos-2 and 143B OS cell lines were transfected with pcDNA3.1(+)-ROCK2 and vectors. ROCK2 mRNA and protein expressions were subsequently determined via reverse transcription-quantitative PCR and Western blotting, respectively. Following ROCK2 overexpression, (C) CCK8 and (D) EdU assays confirmed that the proliferation of OS cells was significantly increased (scale bars:100μM). (E) Representative images obtained from the colony formation assay of OS cells transfected with p-ROCK2 and vectors. (F) following ROCK2 overexpression, flow cytometry was performed to determine the apoptosis rate of OS cells. (G–I), p-ROCK2/143B and vector/143B cells were subcutaneously injected into nude mice, and tumour volumes were measured on the indicated days. At the endpoint, tumours were dissected, imaged and weighed (n=5). *P<0.05 and **P<0.01.
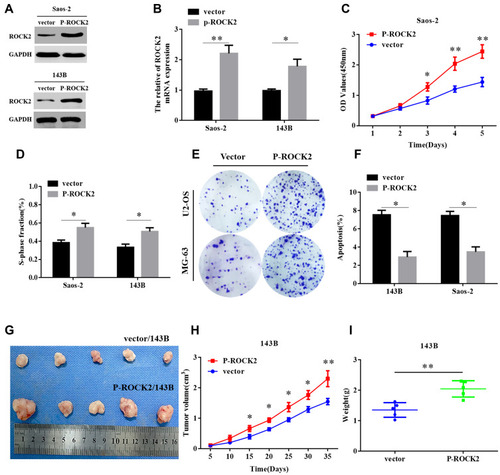
Figure 4 ROCK2 affects the level of glycolysis in OS cells. (A) Cellular G6P levels, (B) glucose consumption, (C) lactate production and (D) ATP levels were analysed in shROCK2 and shNC-treated cells. (E–H) Cellular G6P levels, glucose consumption, lactate production and ATP levels were analysed in OS cells after transfection with p-ROCK2 or vectors. Extracellular acidification rate data revealed the glycolytic rate and capacity in (I) shROCK2 or (J) p-ROCK2 cells. Glucose (10 mM), the oxidative phosphorylation inhibitor oligomycin (1 µM) and the glycolytic inhibitor 2-deoxyglucose (50 mM) were sequentially added to each well at the indicated time point. All measurements were normalized to the cell number calculated using crystal violet at the end of the experiment. Oxygen consumption rate results revealed the basal respiration and maximum respiration of (K) shROCK2 cells and (L) p-ROCK2 cells. Oligomycin (1 µM), the mitochondrial uncoupler carbonyl cyanide p-trifluoromethoxy phenylhydrazone (1.0 µM) and the mitochondrial complex I inhibitor rotenone in addition to the mitochondrial complex III inhibitor antimycin A (0.5 µM) were sequentially added. All measurements were normalized to the cell number calculated using crystal violet at the end of the experiment. *P<0.05 and **P<0.01.
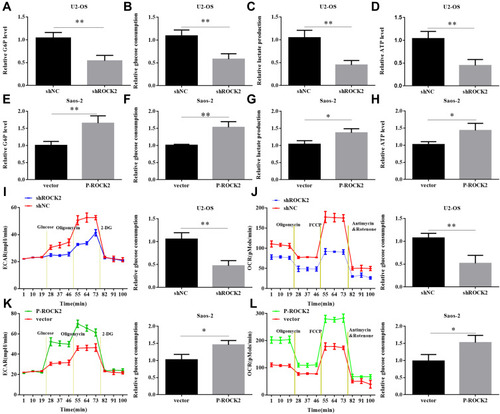
Figure 5 ROCK2 positively regulates HKII protein levels. (A–C) RT-qPCR and Western blot analysis were performed to detect the mRNA and protein expression of HKII in 30 patients with OS and their corresponding adjacent tissues, respectively. (D and E) Scatter plots of ROCK2 and HKII mRNA and protein expression in OS tissue. (F) Representative images of HKII staining in 43 paired OS tissues (scale bar, 50 μm). (G) RT-qPCR and (H) Western blotting were performed to detect the mRNA and protein expression of HKII, respectively, in OS cells (U2-OS, Saos-2, 143B and MG-63) and normal hfoBI-19 cells. (I) Western blotting and (J) RT-qPCR analyses of HKII levels in U2-OS cells stably transfected with shNC or shROCK2 plasmids and in Saos-2 cells stably transfected with the vector or p-ROCK2 plasmid. *P<0.05 and **P<0.01.
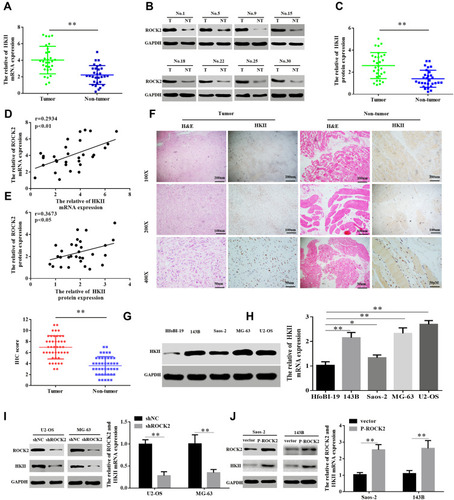
Figure 6 ROCK2 regulates glycolysis and cell proliferation depending on the expression of HKII. (A) Western blotting was performed to detect the expression of ROCK2 and HKII in P-HKII-transfected shROCK2/U2-OS cells. (B) Cell counting kit 8 and (C) EdU results demonstrated the proliferation of U2-OS shROCK2 cells stably transfected with P-HKII. (D) Cellular G6P levels, (E) glucose consumption, (F) lactate production and (G) ATP levels in P-HKII-transfected U2-OS shROCK2 cells. (H) Western blotting was performed to detect ROCK2 and HKII expression in p-ROCK2-transfected Saos-2 cells in the presence or absence of shHKII treatment. (I) CCK8 and (J) EdU results demonstrated the proliferation of Saos-2 cells transfected with p-ROCK2 in the presence or absence of shHKII. (K) Cellular G6P levels, (L) glucose consumption, (M) lactate production and (N) ATP levels were detected in p-ROCK2-transfected Saos-2 cells in the presence or absence of shHKII. *P<0.05 and **P<0.01.
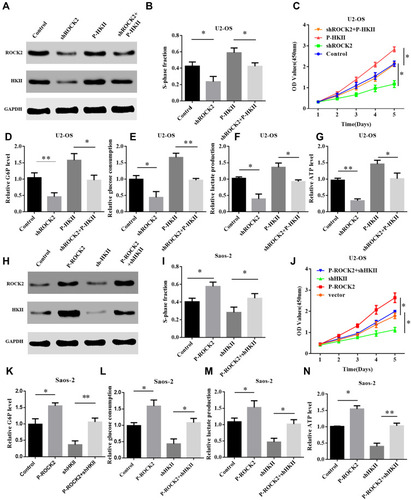
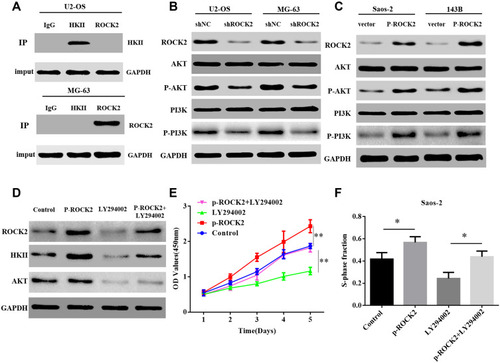
Figure 7 ROCK2 regulates HKII expression by activating the PI3K/AKT signalling pathway via phosphorylation. (A) The results of co-immunoprecipitation indicated that endogenous ROCK2 and HKII were not directly bound. (B) Western blotting was performed to determine the expression of PI3K/AKT and p-PI3K/p-AKT protein in shROCK2 or shNC cells. (C) Western blotting was additionally performed to determine PI3K/AKT and p-PI3K/p-AKT protein expression in p-ROCK2 or vector cells. (D) Western blotting was applied to analyse HKII expression in p-ROCK2 cells after the inhibition of PI3K/AKT signalling. (E) CCK8 and (F) EdU results demonstrated the proliferation of p-ROCK2 cells after PI3K/AKT signalling inhibition (scale bars:100μM). *P<0.05 and **P<0.01.