Figures & data
Table 1 Primer List
Figure 1 The expression levels of LINC01224 and miR-2467 in CRC tissues. (A) The expression level of LINC01224 in 24 pairs of samples of CRC tissues and their adjacent normal tissues was evaluated by qRT-PCR. (B) The expression level of miR-2467 in CRC tissues and adjacent counterparts. (C) The correlation between LINC01224 and miR-2467 was evaluated.
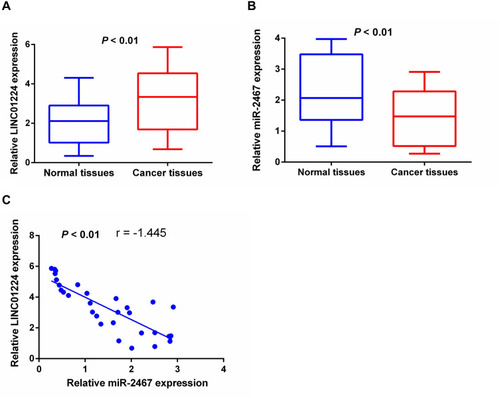
Figure 2 The reciprocal repression effect of LINC01224 and miR-2467. (A) The expression level of LINC01224 and miR-2467 was detected in 4 CRC cell lines and the HFC cell line. (B) SW480 and HCT116 cell lines were transfected with three si- PCAT18 or si-NC. (C) Expression levels of miR-2467 in SW480 and HCT116 cells after knockdown of LINC01224. (D) SW480 and HCT116 cell lines were transfected with NC or LINC01224 and qPCR analysis of miR-2467 after cells were transfected with LINC01224 or NC. **P <0.01.
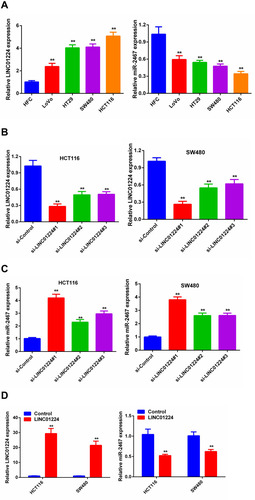
Figure 3 LINC01224 target miR-2467 directly. (A) Binding site of miR-2467 and LINC01224 as predicted by Starbase v 3.0. (B) Relative luciferase activity in HCT116 cells transfected with miR-2467 mimic or mimic-NC and cotransfected with the control vector, LINC01224-wt or LINC01224-mut. (C) RIP assays were conducted to evaluate the amount of LINC01224 bound to Ago2. **P <0.01.
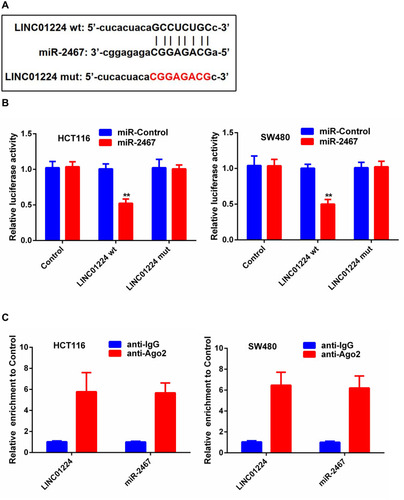
Figure 4 The role of LINC01224 and miR-2467 in CRC cell proliferation and invasion. (A) CCK-8 cell viability assays were used to evaluate the sh-NC, sh- LINC01224, and sh- LINC01224+miR-2467 inhibitor groups. (B) Colony formation assays were used to evaluate the sh-NC, sh- LINC01224, and sh- LINC01224+miR-2467 inhibitor groups. (C) Transwell invasion assays were used to evaluate the sh-NC, sh- LINC01224, and sh- LINC01224+miR-2467 inhibitor groups. **P <0.01.
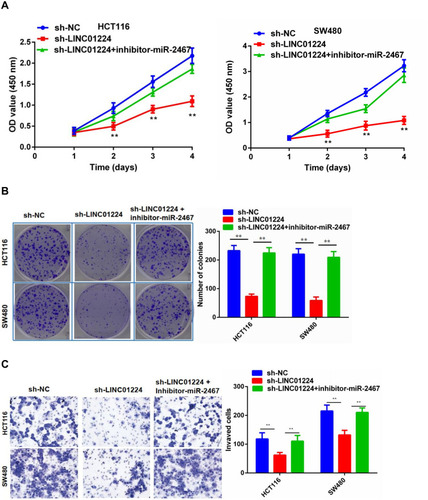
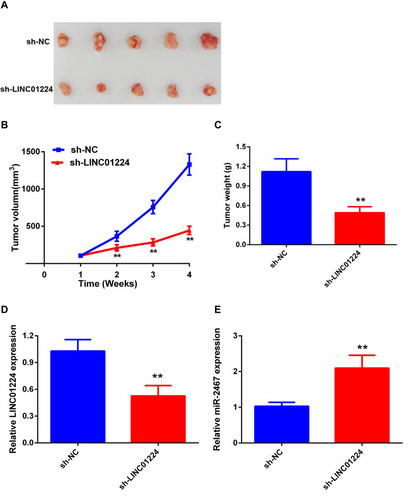
Figure 5 Knockdown of LINC01224 inhibits CRC growth in vivo. (A) The tumor volumes in sh- LINC01224 and sh-NC groups were measured at 4 weeks after injection. (B) The tumor volumes of the mice were measured every week after the cell injection. (C) At 4 weeks later, the mice were killed, and the tumor tissues were excised and weighted. (D) Expression levels of LINC01224 in tumors. (E) Expression levels of miR-2467 in tumors. **P <0.01.