Figures & data
Figure 1 AML group exhibited altered expression of circ_POLA2, mature miR-34a and miR-34a precursor. BM samples were collected from AML patients (n = 50) and healthy controls (n = 50), followed by RNA preparations and RT-qPCRs to analyze the expression of circ_POLA2 (A), mature miR-34a (B) and miR-34a precursor (C). Unpaired t test was used to compare two groups. The Kaplan-Meier survival curve showed the survival rate in patients with high expression levels of circ_POLA2 and those with low expression levels of circ_POLA2 (D). ***p < 0.001.
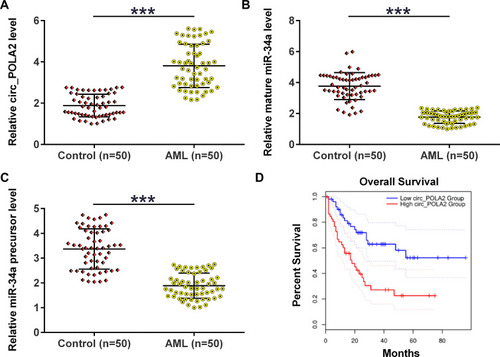
Figure 2 Circ_POLA2 was only inversely correlated with mature miR-34a. To analyze the relationship between circ_POLA2 and mature miR-34a (A) or miR-34a precursor (B), Pearson’s correlation coefficient was used to analyze the correlations among them.
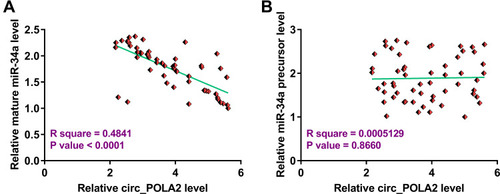
Figure 3 Overexpression of circ_POLA2 suppress the maturation of miR-34a in AML cells. The expression of circ_POLA2 was detected in human bone marrow stromal HS-5 cells and two human AML cell lines (A). To explore the role of circ_POLA2 in the maturation of miR-34a, Kasumi-6 and Kasumi-3 cells were transfected with either circ_POLA2 expression vector or miR-34a mimic. Expression of circ_POLA2 and mature miR-34a expression was determined every 24 h until 144 h (B and C). The effects of circ_POLA2 expression vector transfection on the expression of mature miR-34a (D) and the expression of miR-34a precursor at each time point (E), as well as the effects of miR-34a mimic transfection on the expression of circ_POLA2 (F) were analyzed by RT-qPCR. *p < 0.05.
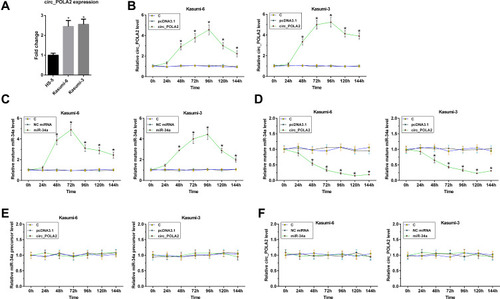
Figure 4 Overexpression of circ_POLA2 increased the proliferation of AML cells through miR-34a. The role of circ_POLA2 and miR-34a in the proliferation of Kasumi-6 and Kasumi-3 cells were analyzed by CCK-8 assay. OD values at 450 nm were measured every 24 h until 96 h to monitor cell proliferation. *p < 0.05.
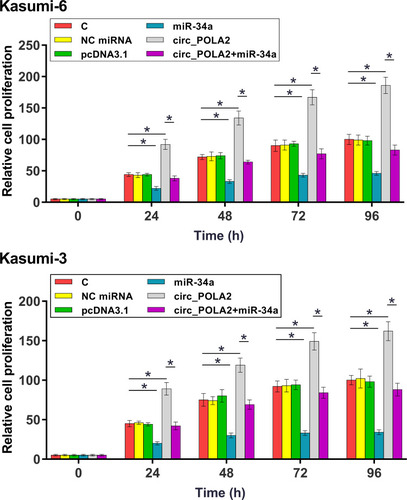
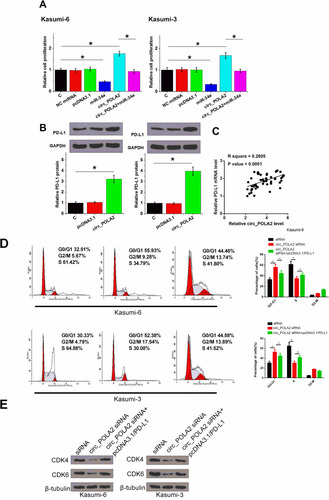
Figure 5 Overexpression of PD-L1 rescued the effect of knockdown of circ_POLA2. BrdU assay was performed to further confirm the role of circ_POLA2 and miR-34a (A). The role of circ_POLA2 in regulating the expression of PD-L1 was analyzed by Western-blot (B). The expression of PD-L1 mRNA in BM samples were also analyzed RT-qPCR. Pearson’s correlation coefficient was performed to analyze the correlation between circ_POLA2 and PD-L1 mRNA across BM tissues from AML patients (C). Cell cycle was measured by flow cytometric analysis (D). CDK4, CDK6 protein levels were measured by Western blot in Kasumi-6 and Kasumi-3 cells (E). *p < 0.05.