Figures & data
Figure 1 Establishment of SLC39A4 stably knocked-down cell lines in GBC-SD cells and NOZ cells. (A and B) Knockdown efficiency of three shSLC39A4s was evaluated in GBC-SD cells by real-time RT-qPCR (A) and Western blotting (B) and shSLC39A4-2 was selected to carry out subsequent experiments. (C and D) Confirmation of SLC39A4 expression in NOZ shSLC39A4-2 (NOZ/shSLC39A4-2) and control (NOZ/shCtrl) cells by real-time RT-qPCR (C) and Western blotting (D). The results of real-time RT-qPCR are the mean ± SD (unpaired t-test). *p < 0.05, **p < 0.01, ***p < 0.001, compared with NOZ/shCtrl or GBC-SD/shCtrl.
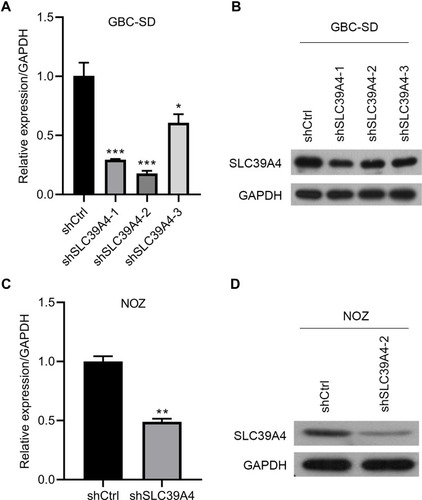
Figure 2 Knockdown of SLC39A4 expression suppressed cell proliferation and colony formation. (A and B) MTT assays were undertaken to evaluate proliferation of NOZ/shSLC39A4-2 cells (A) and GBC-SD/shSLC39A4-2 cells (B). (C and D) Colony-formation assays of NOZ/shSLC39A4-2 cells (C) and GBC-SD/shSLC39A4-2 cells (D). Images and quantitation are shown. Data are the mean ± SD (unpaired t-test) *p<0.05, **p<0.01, ***p < 0.001, compared with NOZ/shCtrl or GBC-SD/shCtrl.
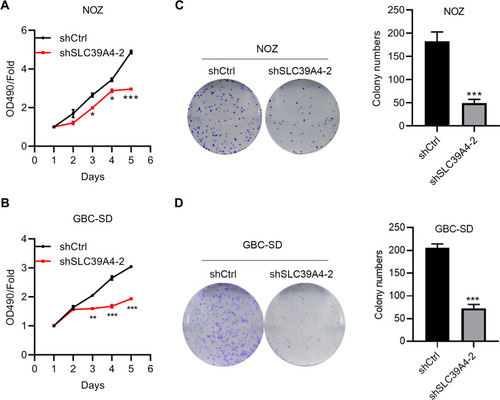
Figure 3 Knockdown of SLC39A4 expression impeded cell migration. (A and B) Wound-healing assays were undertaken to evaluate migration of NOZ/shSLC39A4-2 cells (A) and GBC-SD/shSLC39A4-2 cells (B). Representative images (magnification, ×100) and quantitation are shown. (C and D) Transwell-migration assays were conducted to observe the transmigration capability of NOZ/shSLC39A4-2 cells (C) and GBC-SD/shSLC39A4-2 cells (D). Representative images (magnification, ×200) and quantitation are shown. Data are the mean ± SD (unpaired t-test). **p < 0.01, ***p < 0.001, compared with NOZ/shCtrl or GBC-SD/shCtrl.
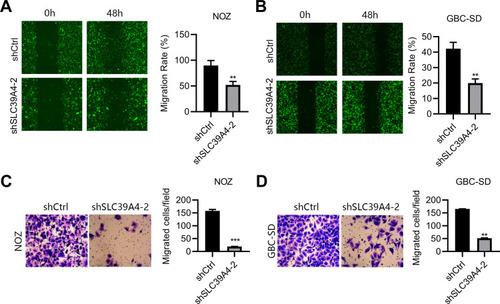
Figure 4 Knockdown of SLC39A4 expression induced apoptosis and cell-cycle arrest. (A–D) Apoptosis analyses were done in GBC-SD cells and NOZ cells using FACS (A and C), and apoptotic percentages were calculated by normalizing values to the total number of cells (B and D). Data are the mean ± SD (unpaired t-test). **p<0.01, compared with NOZ/shCtrl or GBC-SD/shCtrl. (E–H) Cell-cycle distributions were analyzed by FACS (E and G) and quantitation are shown in (F and H), after normalization to the total cell number. Data are the mean ± SD (unpaired t-test). *p < 0.05, compared with control cells.
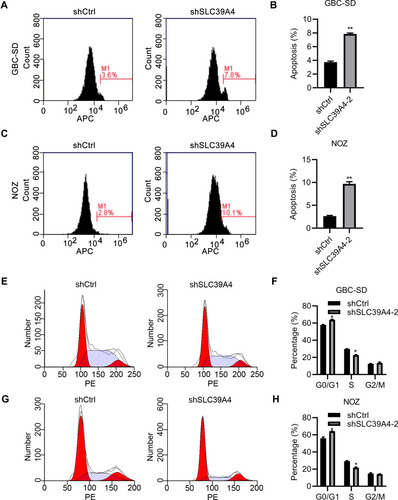
Figure 5 Overexpression of SLC39A4 promoted the growth and migration of cells. (A) Real-time RT-qPCR was done to confirm expression of exogenous SCL39A4 in GBC-SD cells and NOZ cells. mRNA expression was normalized to that of GAPDH. (B) MTT assays were undertaken to evaluate cell proliferation. (C–F) Cycle distributions were analyzed in GBC-SD cells and NOZ cells overexpressing SLC39A4 by FACS (C and E) and data are presented in (D and F) normalized to the total cell number. (G–J) Transwell-migration assays were conducted to observe the transmigration capability of NOZ/SLC39A4 cells and GBC-SD/SLC39A4 cells. (G and I) Representative images (magnification, ×200) and (H and J) quantitation are shown. Data are the mean ± SD (unpaired t-test). *p < 0.05, **p < 0.01, ***p < 0.001, compared with control cells.
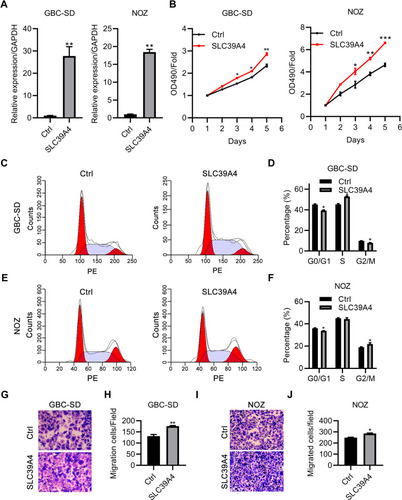
Figure 6 Knockdown of SLC39A4 expression repressed tumor formation in nude mice. (A) Surgically excised tumor tissue 18 days after initial implantation. (B) Growth curves of subcutaneously implanted tumors. Tumor volumes were measured at the indicated timepoints. (C) Average weight of implanted tumors in NOZ/shSLC39A4-2 xenograft-bearing mice. Data are the mean ± SD (unpaired t-test). **p < 0.01, ***p < 0.001, compared with NOZ/shCtrl. (D) IHC analyses of SLC39A4, c-Met and Ki-67 in tumors of control and shSLC39A4-2 groups. Scale bar, 100 μm.
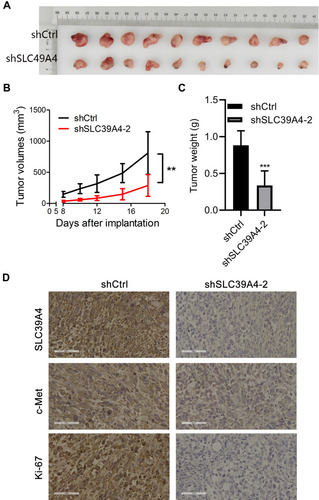
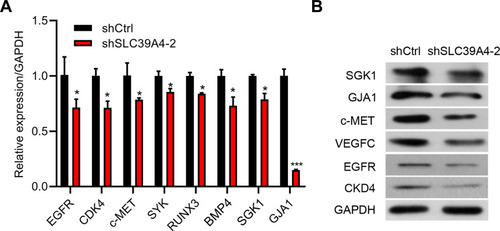
Figure 7 Downregulation of SLC39A4 expression influenced the malignant-development potential of GBC-SD cells. (A) mRNA expression of target genes in GBC-SD/shSLC39A4-2 cells by real-time RT-qPCR. Results are representative of three independent experiments, and are shown as the mean ± SD (unpaired t-test). *p < 0.05, ***p < 0.001, compared with GBC-SD/shCtrl. (B) Protein expression of indicated target genes in GBC-SD/shSLC39A4-2 cells by Western blotting.