Figures & data
Figure 1 Workflow of the bioinformatics analysis.
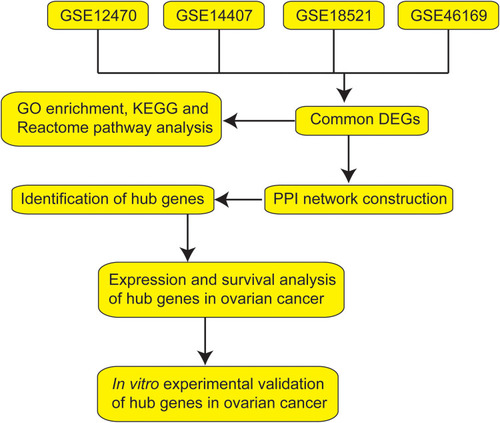
Table 1 Information of the Selected GEO Datasets
Figure 2 Identification of common DEGs in the GSE12470, GSE14407, GSE18521 and GSE46169. Volcano plots of DEGs in GSE12470 (A), GSE14407 (B), GSE18521 (C) and GSE46169 (D) are shown. (E) Venn diagram shows the common up-regulated DEGs in the datasets. (F) Venn diagram shows the common down-regulated DEGs in the datasets.
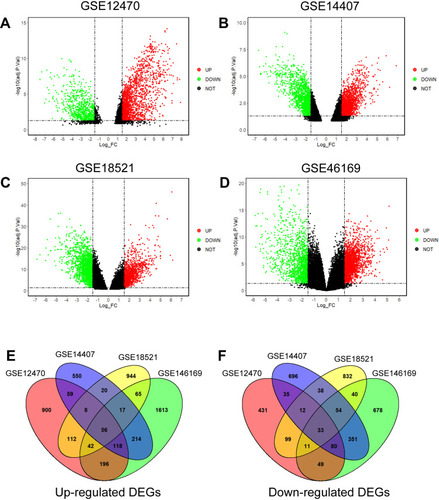
Figure 3 Functional and pathway enrichment analysis. GO enrichment analysis of common DEGs: (A) cellular component, (B) biological process and (C) molecular function. (D) KEGG pathway enrichment analysis of common DEGs. (E) Reactome pathway enrichment analysis of common DEGs.
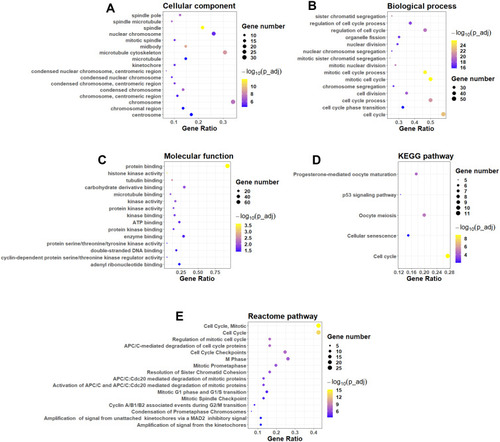
Figure 4 Construction of PPI network of common DEGs. (A) PPI network constructed using STRING database. (B) The interactions among different genes are further presented using Cytoscape software.
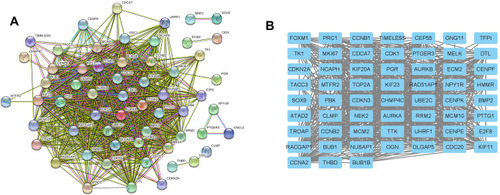
Figure 5 Sub-module analysis of PPI network. (A) Sub-module network analyzed by MCODE. (B) Sub-module network analyzed by cytoHubba, and top 20 genes are shown.
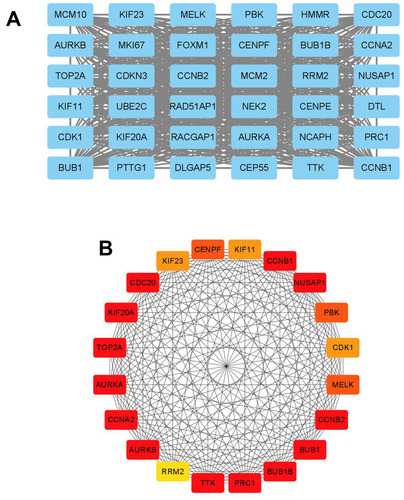
Figure 6 The correlation analysis between hub genes and OS of patients with ovarian cancer. The association between the expression levels of AURKA (A), BUB1 (B), BUB1B (C), CENPF (D), KIF11 (E), KIF23 (F) and TOP2A (G) and the OS of patients with ovarian cancer was analyzed by KM plotter (www.kmplot.com).
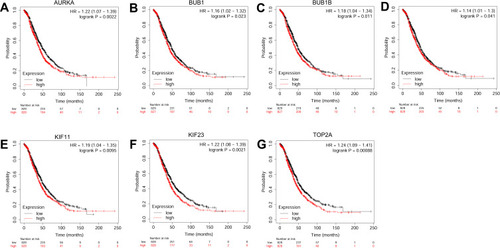
Figure 7 The correlation analysis between hub genes and PFS of patients with ovarian cancer. The association between the expression levels of AURKA (A), BUB1B (B), CENPF (C), KIF11 (D), KIF23 (E) and TOP2A (F) and the PFS of patients with ovarian cancer was analyzed by KM plotter (www.kmplot.com).
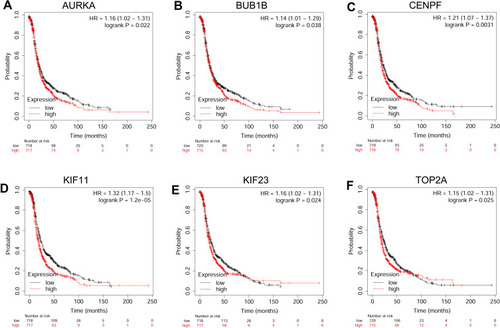
Figure 8 Expression analysis of hub genes. The expression levels of AURKA (A), BUB1B (B), CENPF (C), KIF11 (D), KIF23 (E) and TOP2A (F) in ovarian cancer tissues and normal ovarian tissues were analyzed by GEPIA tool. *P < 0.05.
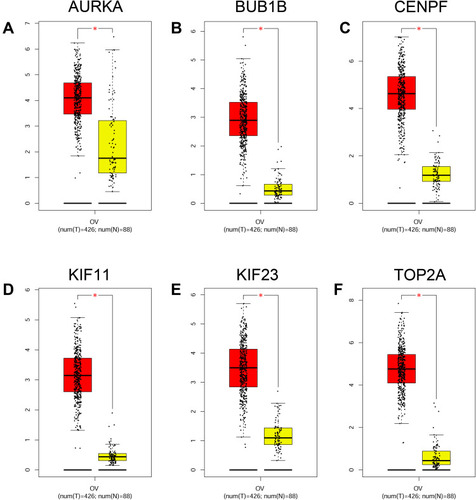
Figure 9 Protein expression of hub genes. The protein expression of AURKA (A), CENPF (B), KIF11 (C), KIF23 (D) and TOP2A (E) in ovarian cancer tissues and normal ovarian tissues were extracted from the Human Protein Atlas (http://www.proteinatlas.org/).
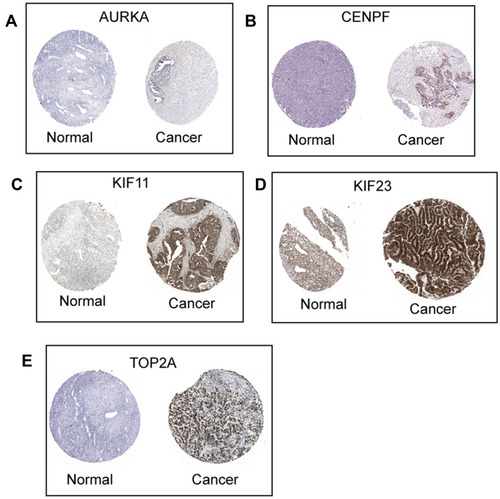
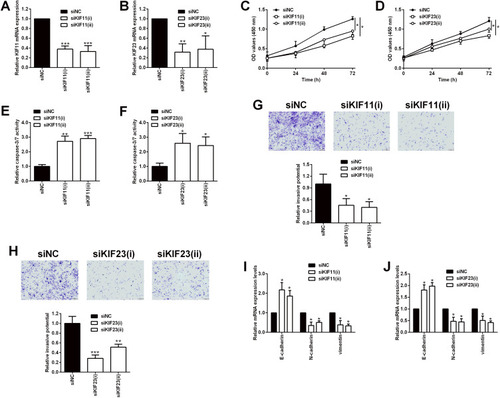
Figure 10 Effects of KIF11 and KIF23 knockdown on the proliferation and invasion of ovarian cancer cells. (A) KIF11 and (B) KIF23 mRNA expression levels in SKOV3 cells being transfected with siRNAs for KIF11 (siKIF11(i) and siKIF11(ii)) and the scrambled siRNA (siNC) were determined by qRT-PCR. (C) The proliferation of SKOV3 cells after being transfected with siNC, siKIF11(i) and siKIF11(ii) was determined by CCK-8 assay. (D) The proliferation of SKOV3 cells after being transfected with siNC, siKIF23(i) and siKIF23(ii) was determined by CCK-8 assay. (E) The caspase-3/7 activity of SKOV3 cells after being transfected with siNC, siKIF11(i) and siKIF11(ii) was determined by the caspase-3/7 activity assay kit. (F) The caspase-3/7 activity of SKOV3 cells after being transfected with siNC, siKIF23(i) and siKIF23(ii) was determined by the caspase-3/7 activity assay kit. (G) The invasion of SKOV3 cells after being transfected with siNC, siKIF11(i) and siKIF11(ii) was determined by transwell invasion assay. (H) The invasion of SKOV3 cells after being transfected with siNC, siKIF23(i) and siKIF23(ii) was determined by transwell invasion assay. (I) The mRNA expression levels of E-cadherin, N-cadherin and vimentin in SKOV3 cells after being transfected with siNC, siKIF11(i) and siKIF11(ii) were determined by qRT-PCR. (J) The mRNA expression levels of E-cadherin, N-cadherin and vimentin in SKOV3 cells after being transfected with siNC, siKIF23(i) and siKIF23(ii) were determined by qRT-PCR. siNC = scrambled negative control siRNA, siKIF11 = KIF11 siRNA, siKIF23 = KIF23 siRNA. N = 3; *P < 0.05, **P < 0.01 and ***P < 0.001 compared to the siNC group.