Figures & data
Figure 1 Cell viability of OSCC cells determined by MTT assay after lycopene. (A) CAL-27 cells and (B) WSU-HN6 cells cell lines were incubated with 0.25–2 µM lycopene from 12 to 72 h. The percentage of cell viability was shown in a dose- and time-dependent manner. The data were performed independently in triplicate and presented as mean ± SD, *P<0.05, **P<0.01.
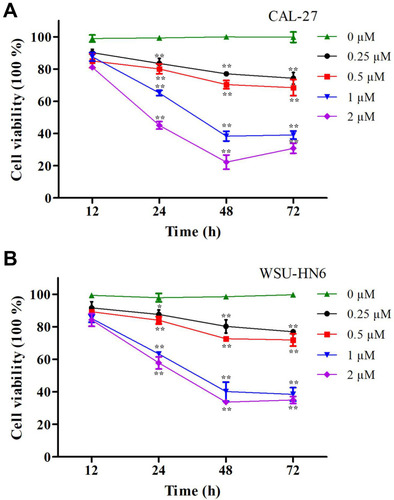
Figure 2 Lycopene suppresses the cell migration of the OSCC cell lines (CAL-27, WSU-HN6). The wound-healing assay showed that the relative migration of cells incubated with lycopene in (A) CAL-27 and (B) WSU-HN6 cell lines was significantly less than the control group.
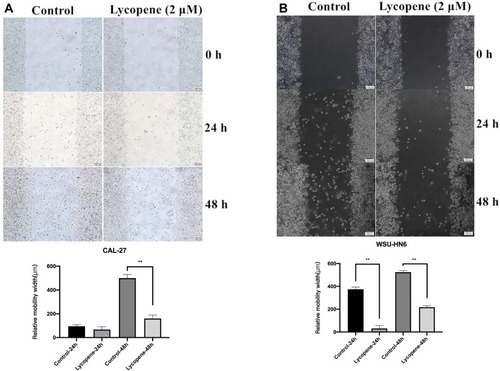
Figure 3 Apoptosis assay using flow cytometry of (A) CAL-27 and (B) WSU-HN6 cell lines in the lycopene and control group. Representative flow cytometry figures are shown.
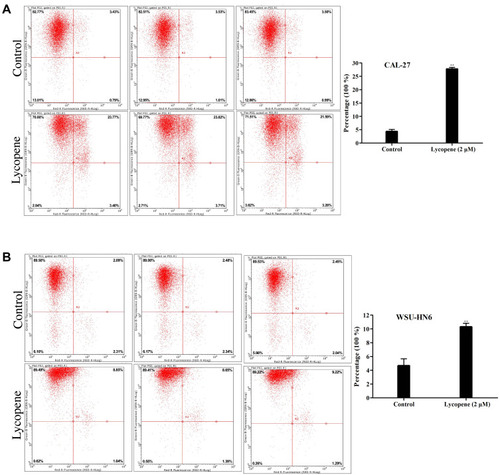
Figure 4 (A) Lycopene inhibited tumor cell growth in nude mice (n = 5). (B) Tumor volume was estimated by the following equation: volume =1/2×(largest diameter)×(smallest diameter)2 and data are shown as the mean ± SD (n = 5 in each group).
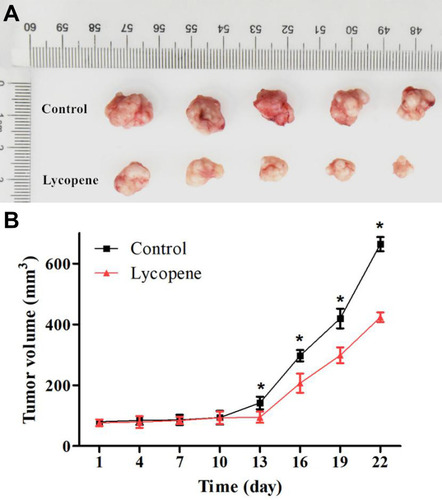
Figure 5 Gene expression profiling identified an association between changes in the lycopene group. (A) Classical Pathway analysis identified genes enriched after incubating lycopene. Orange marks indicates activated (Z-score>0) and the blue marks means suppressed pathways (Z-score<0). (B) Hierarchical clustering of differentially expressed transcripts. The red dots represent upregulated relative expression, whereas green means indicates relative downregulation.
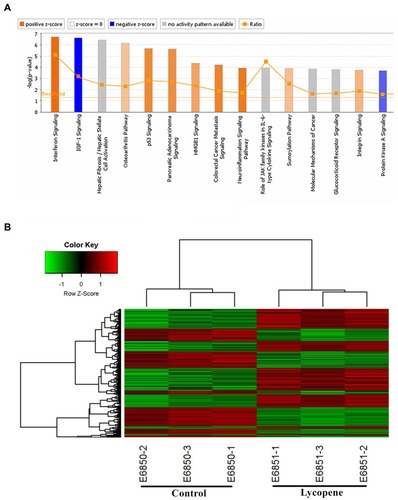
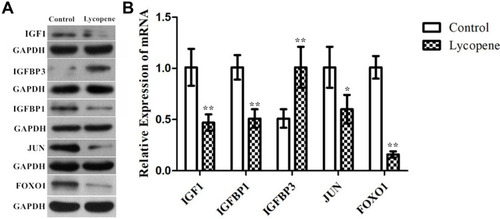
Figure 6 The protein and mRNA expression of IGF1 signalling pathway by Western blotting. Confirmation of microarray results using (A) Western blot analysis and (B) RT-qPCR of IGF1, IGFBP1, IGFBP3, JUN, and FOXO1 in tumor tissues. GAPDH was used as the internal control. In all above experiments, the data were performed independently in triplicate and presented as mean ± SD, *P<0.05, **P<0.01.