Figures & data
Figure 1 PRDX6 was highly expressed in NSCLC. (A) KEGG enrichment graph. Data were obtained from the TCGA database and analyzed by SangerBox. Volcano plots and heat maps of differentially expressed genes revealed that the PRDX6 gene was highly expressed in NSCLC. (B) Volcano map of differentially expressed genes. (C) Heatmap of differentially expressed genes. (D) The expression of PRDX6 in tumor tissue samples was detected by fluorescence qPCR assay. (E and F) The expression of PRDX6 in tumor tissues and adjacent tissues was detected by IHC assay. Brown indicates positive PRDX6 expression, blue indicates the nucleus. Scale bar, 20 μm. Immunoreactivity is shown in brown, with a blue hematoxylin counterstain. ##P<0.01.
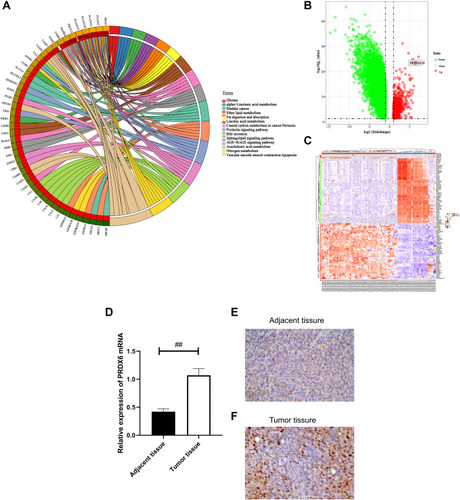
Figure 2 PRDX6 overexpression promoted the proliferation of A549 cells. (A) PRDX6 expression in A549 cells transfected with the pcDNA3.1-PRDX6 plasmid or pcDNA3.1-vector was determined by qPCR. (B) Cell Counting Kit-8 assay was used to analyze A549 cell viability at the indicated times. A549 cells were transfected with pcDNA3.1-PRDX6 plasmid and pcDNA3.1-vector for 48 h, respectively. (C) Relative expression of PRDX6 was detected by qPCR. PRDX6 mRNA expression was detected following three PRDX6 siRNA sequences and NC was transfected into A549 for 48 h, respectively. (D) Cell Counting Kit-8 assay was used to analyze the viability of A549 cells at the indicated times following transfection with PRDX6 siRNA. (E) The expression of PRDX6 protein was detected by Western blotting. #P<0.05; ##P<0.01.
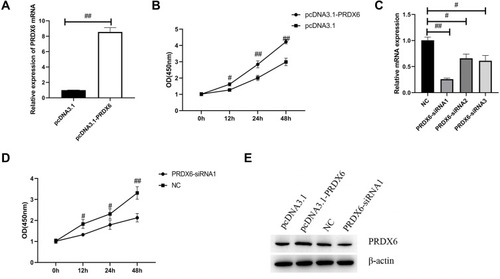
Figure 3 Cell proliferation and apoptosis detected by flow cytometry. (A) Cell proliferation and apoptosis were detected by flow cytometry by double staining with PI and Annexin V. (B) BrdU staining; the positive rate of BrdU was detected by flow cytometry. The higher the positive rate, the higher rate of proliferation. #P<0.05; ##P<0.01.
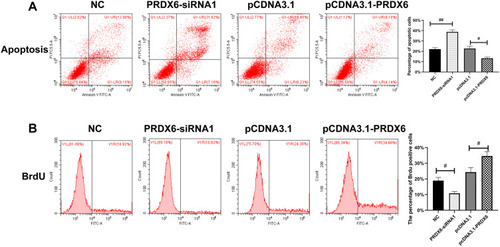
Figure 4 PRDX6 overexpression promoted EMT, migration, and invasion of A549 cells. The effects of PRDX6 on A549 cell migration and invasion ability were analyzed by transwell and scratch tests. (A) Cells were transfected with either pcDNA3.1-PRDX6/pcDNA3.1-vector plasmid or with NC or PRDX6 siRNA for 24 h. Cell invasion and migration were detected by transwell assay and cell scratch test (images obtained after scratching at 0 h and after being cultured for 24 h). Scale bar, 100 μm. (B) Expression of E-cadherin, vimentin, and TWIST in A549 cells treated with pcDNA3.1-PRDX6 or pcDNA3.1-vector plasmid or NC or PRDX6 siRNA for 48 h were detected by qPCR. NC was the control for the PRDX6 siRNA group; the pcDNA3.1-vector plasmid was the control for pcDNA3.1-PRDX6. (C and D) Expression of E-cadherin, vimentin, and TWIST in A549 cells was detected by Western blotting. #p<0.05; ##p<0.01.
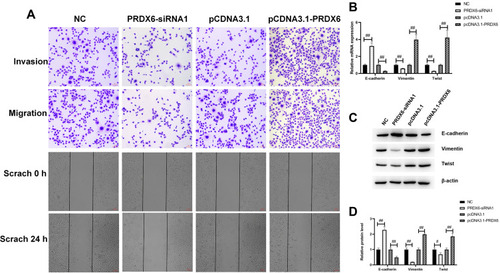
Figure 5 PRDX6 interacted with β-catenin and regulated the migration, invasion, proliferation, and apoptosis of A549 cells. (A) Binding of endogenous PRDX6 to endogenous β-catenin in A549 cells was detected by immunoprecipitation assay. (B) Expression levels of pβ-catenin, β-catenin, TCF-4, c-Myc, and MMP14 were determined by Western blotting following the transfection of A549 cells with the pcDNA3.1-PRDX6 plasmid or pcDNA3.1-vector for 48 h. (C) A549 cells were transfected with β-catenin plasmid or β-catenin-siRNA. Invasion, migration, apoptosis, and proliferation were measured. Scale bar, 100 μm.
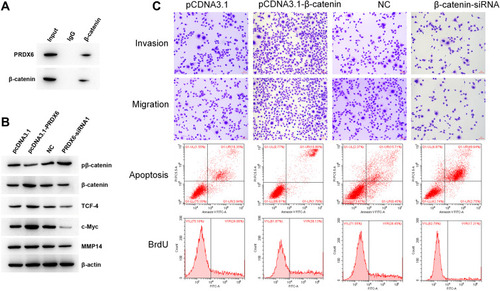
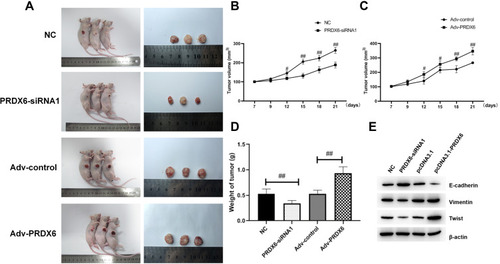
Figure 6 Influence of PRDX6 on the process of A549 growth in vivo. (A) The effects of PRDX6 on the growth of A549 cells were determined by nude mouse tumorigenicity assay. (B) Tumor volume of the PRDX6 interference and control groups. (C) Tumor volume of the PRDX6 overexpression and control groups. (D) Tumor weight detection of the PRDX6 interference and control groups and the PRDX6 overexpression and control groups. (E) After 21 days of lentivirus injection, tumors were collected and total tissue protein was extracted. Protein expression was detected by Western blotting. #P<0.05; ##P<0.01.