Figures & data
Figure 1 LncRNA SBF2-AS1 was increased in DLBCL tissue and cells. (A) microanalysis of lncRNAs in DLBCL adjacent normal tissues and cancer tissue. (B) The expression of SBF2-AS1 in DLBCL tissues (n = 50) and adjacent normal tissues (n = 50) determined by qRT-PCR (*p<0.05). (C) qRT-PCR for the expression of SBF2-AS1 in DLBCL cell lines (OCI-LY-3, OCI-LY-7, OCI-LY-10, SU-DHL-4, SU-DHL-6) and normal human B-lymphocytes GM12878, (n = 6, *p<0.05). The above measurement data were expressed as mean ± standard deviation. Data among multiple groups were analyzed by one-way ANOVA, followed by a Tukey post hoc test. The experiment was repeated in triplicate.
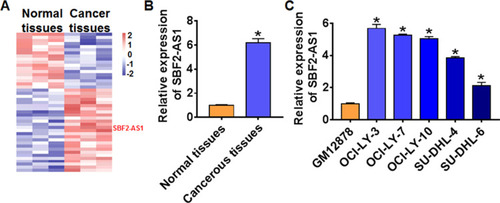
Figure 2 Knockdown of SBF2-AS1 inhibits proliferation, migration and invasion in OCI-LY-3 cells. (A) The expression of SBF2-AS1 in OCI-LY-3 cells after SBF2-AS1 si-RNA or si-Scramble transfection was determined by qRT-PCR (n = 6, *p<0.05). (B) CKK-8 assay was used to examine the cell growth at 0, 24, 48 and 72 h (n = 10, *p<0.05). (C) Edu assay was used to calculated cell proliferation (n = 4, *p<0.05). Scale bar 100 μm. (D) Wound healing assay was used to detect cell migration (n = 4, *p<0.05). Scale bar 250 μm. (E) Transwell assay was performed to check cell invasive ability (n = 4, *p<0.05). Scale bar 250 μm. The above measurement data were expressed as mean ± standard deviation. Data among multiple groups were analyzed by one-way ANOVA, followed by a Tukey post hoc test. The experiment was repeated in triplicate.
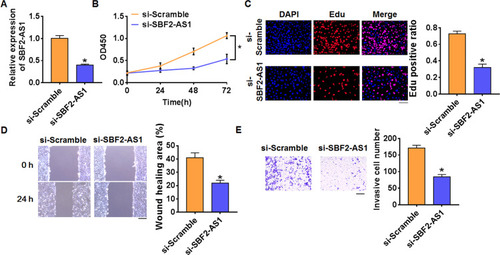
Figure 3 SBF2-AS1 regulated miR-494-3p expression. (A) The paired bases of SBF2-AS1 with miR-494-3p. (B) WT and mutant miR-494-3p luciferase plasmids were transfected into HEK293 cells with pcDNA3.1 or SBF2-AS1. The luciferase activity was measured by dual-luciferase reporter assay system. (n = 6, *p<0.05). (C) SBF2-AS1 or si-SBF2-AS1 or its NC was transfected into OCI-LY-3 cells. The mRNA level of miR-494-3p was analyzed by qRT-PCR (n = 6, *p<0.05). The mRNA level of miR-494-3p in DLBCL tissues (D) and cells (E) was detected by qRT-PCR (n = 6, *p<0.05). The above measurement data were expressed as mean ± standard deviation. Data among multiple groups were analyzed by one-way ANOVA, followed by a Tukey post hoc test. The experiment was repeated in triplicate.
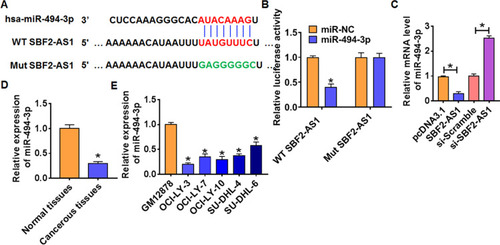
Figure 4 FGFR2 was a direct target of miR-494-3p. (A) Targeting prediction results of miR-494-3p with FGFR2. (B) WT and mutant FGFR2 luciferase plasmids were transfected into HEK293 cells with NC or miR-494-3p. The luciferase activity was measured by dual-luciferase reporter assay system. (n = 6, *p<0.05). miR-494-3p or AMO-494-3p or its NC was transfected into OCI-LY-3 cells. (C) The mRNA level of FGFR2 was analyzed by qRT-PCR (n = 6, *p<0.05). (D) Western blot was performed to detect FGFR2 protein expression of (n = 6, *p<0.05). The mRNA level of FGFR2 in DLBCL tissues (E) and cells (F) was detected by qRT-PCR (n = 6, *p<0.05). The above measurement data were expressed as mean ± standard deviation. Data among multiple groups were analyzed by one-way ANOVA, followed by a Tukey post hoc test. The experiment was repeated in triplicate.
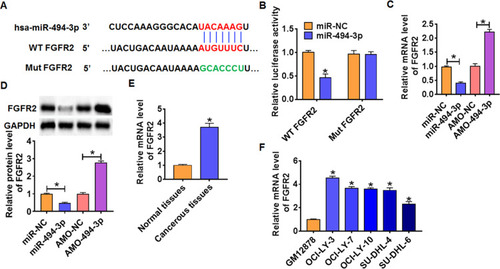
Figure 5 LncRNA SBF2-AS1 promotes DLBCL progression via miR-494-3p/FGFR2 axis. (A) SBF2-AS1 plasmid was transfected into SU-DHL-6 cells with miR-494-3p or si-FGFR2, and qRT-PCR analysis was used to detect the transfection efficiency (n = 6, *p<0.05 vs pcDNA3.1, #p<0.05 vs SBF2-AS1). CCK8 assay (B) and Edu assay (C) for cell proliferation (n = 4, *p<0.05 vs pcDNA3.1, #p<0.05 vs SBF2-AS1). (D) Wound healing assay for cell migration (n = 4, *p<0.05 vs pcDNA3.1, #p<0.05 vs SBF2-AS1). (E) Transwell assay for cell invasive ability (n = 4, *p<0.05 vs pcDNA3.1, #p<0.05 vs SBF2-AS1). The above measurement data were expressed as mean ± standard deviation. Data among multiple groups were analyzed by one-way ANOVA, followed by a Tukey post hoc test. The experiment was repeated in triplicate.
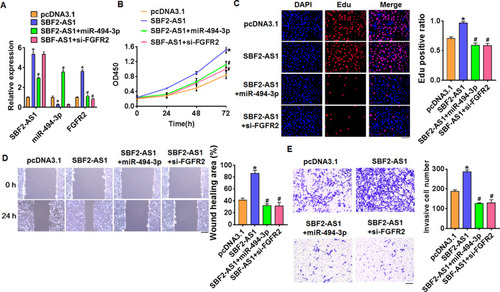
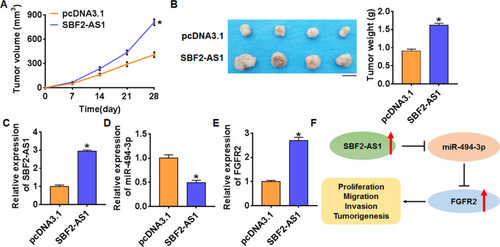
Figure 6 LncRNA SBF2-AS1 promotes in vivo tumor growth in the nude mice. The nude mice were subcutaneously injected with SU-DHL-6 cells into the right flanks of the nude mice. 1 week later, we injected lentivirus packaged SBF2-AS1 or pcDNA3.1 into tumors. (A) The tumor volume was assessed in the nude mice every 7 days (n = 6, *p<0.05). (B) Tumor weight was determined in the isolated tumors from the nude mice (n = 6, *p<0.05). (C) The relative expression of SBF2-AS1 was determined by qRT-PCR in the isolated tumor tissues (n = 6, *p<0.05). qRT-PCR was performed to detect the relative mRNA expression of miR-494-3p (D) and FGFR2 (E) (n = 6, *p<0.05). (F) Proposed signaling mechanism for SBF2-AS1 and miR-494-3p in DLBCL development. The above measurement data were expressed as mean ± standard deviation. Data among multiple groups were analyzed by one-way ANOVA, followed by a Tukey post hoc test. The experiment was repeated in triplicate.