
Figures & data
Table 1 Malignant Risk of Thyroid Nodules Reported by Modified TI-RADS and Corresponding Medical Suggestion
Figure 1 The classification standard for modified TI-RADS system. (A) Grade 0 by improved TI-RADS system; (B) Grade 1 by improved TI-RADS system; (C), Grade 2 by improved TI-RADS system; (D) Grade 3 by improved TI-RADS system; (E) Grade 4a by improved TI-RADS system; (F) Grade 4b by improved TI-RADS system; (G) Grade 4c by improved TI-RADS system; (H) Thyroid nodules, Grade 5 by improved TI-RADS system; (I and H) Lymphatic metastasis, Grade 5 by improved TI-RADS system; (J) Thyroid papillary cancer under microscope by 400×, Grade 6 by improved TI-RADS system.
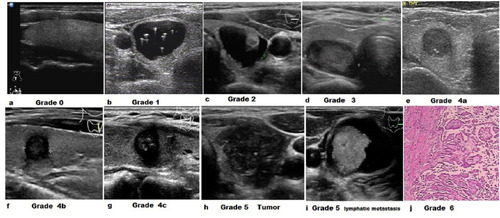
Table 2 Incidence of Thyroid Nodules and Detection Rate of Thyroid Cancer Between Males and Females
Table 3 Clinical Characteristics of the Thyroid Cancer Patients
Figure 2 The incidence of thyroid nodules and thyroid cancer among patients (A) incidence of thyroid nodules among different age teams; (B) incidence of high risk nodules among different age teams; (C) incidence of diagnosed thyroid cancer among different age teams; (D) thyroid cancer incidence in each grade by the modified TI-RADS; (E) comparison with the average ages between the low risk group and the high risk group (P<0.001); and (F) comparison with the average age between undiagnosed and diagnosed thyroid cancer patients in the high risk group (P<0.001).
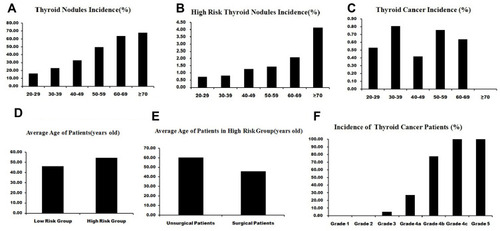
Table 4 Thyroid Nodules Detection by Ultrasonography Reported by Modified TI-RADS System During the 5-year Follow-Up
Table 5 Thyroid Nodules Changes with Modified TI-RADS Grades During the 5 Year Follow-Up