Figures & data
Figure 1 Schematics of the decision tree and the Markov state transition model.
Notes: A network of four health states linked by transitional variables. During each 4-weeks cycle, patients either remained in their assigned health state or progressed to a new health state. It was assumed that the patients could not go back to previous health states.
Abbreviation: M, Markov node.
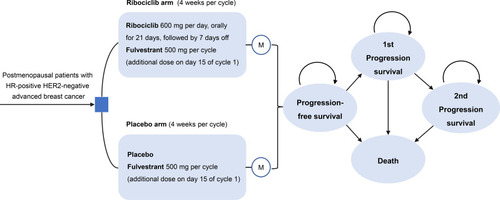
Table 1 Model Parameters: Baseline Values, Ranges, and Distributions for Sensitivity Analysis
Table 2 Incidence and Expenditures on Grade 3 or 4 AEs
Table 3 Base Case Results
Figure 2 Tornado diagram for the one-way sensitivity analysis.
Notes: The dark blue bar represents the upper bounds and the light blue bar represents the lower bounds for each variable.
Abbreviations: FUL, fulvestrant; ICER, incremental cost-effectiveness ratio; PD, progression disease; PFS, progression-free survival; RIB, ribociclib; QALY, quality-adjusted life year.
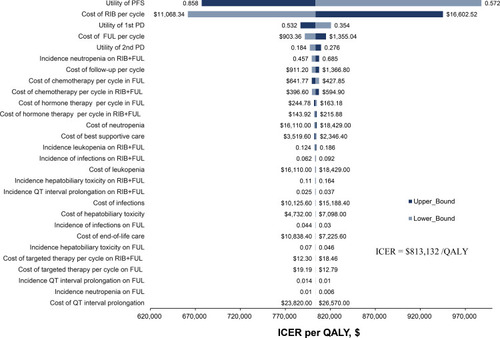
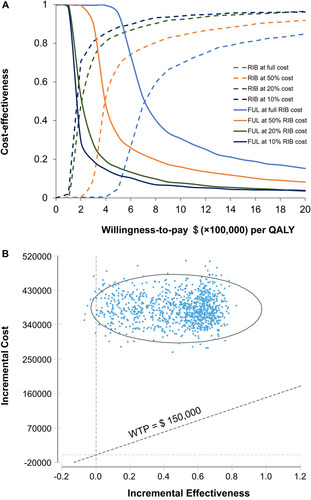
Figure 3 Probabilistic sensitivity analysis.
Notes: (A) Cost-effectiveness acceptability curves revealed the effects of cost on the probability of being cost-effective; (B) Incremental cost-effectiveness scatterplot for 10,000 Monte Carlo simulations revealed a low probability of cost effectiveness.
Abbreviations: FUL, fulvestrant; RIB, ribociclib; QALY, quality-adjusted life year; WTP, willingness-to-pay.