Figures & data
Table 1 The Clinical Characteristics of All the Patients
Table 2 Comparison of MRI, PSMA-SPECT/CT and Clinical Parameters Between Good Responders and Poor Responders
Figure 1 TBR (A) and ADC (B) changes after CIRT of good responders and poor responders. *p< 0.05.
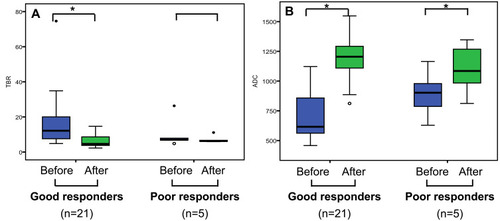
Figure 2 Scatter-plot showing relationship between Δ TBR and Δ ADCmean after CIRT.
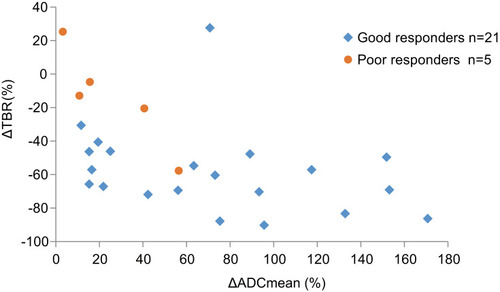
Figure 3 ROC curves used to evaluate good response to CIRT with Δ TBR, Δ ADCmean and combined used of Δ TBR and Δ ADCmean, AUC of Δ TBR (0.867) was higher than that of Δ ADCmean (0.819). AUC increased with combined used of Δ TBR and Δ ADCmean (0.895).
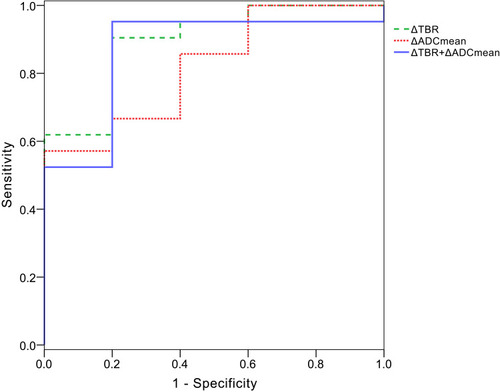
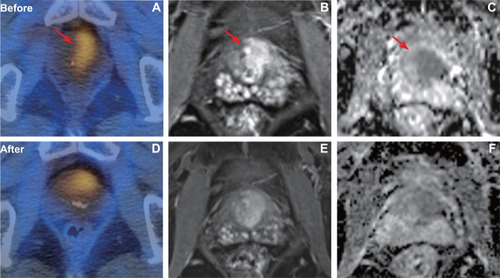
Figure 4 A patient with pathology confirmed prostate cancer of Gleason score 4+4 (T3bN0M0, very high risk) who showed good response after CIRT. PSMA uptake (A) was visualized on the prostate with TBR of 34.9. After CIRT, the SPECT/CT (D) showed PSMA uptake was significantly decreased with TBR of 3.4. Axial T1 weighted MRI showed the tumor before (B) and after (E) CIRT. In baseline ADC map (C), ADCmean was 0.616×10⁻³ mm2/s. In post CIRT ADC map (F), ADCmean was 1.205 × 10⁻³ mm2/s.
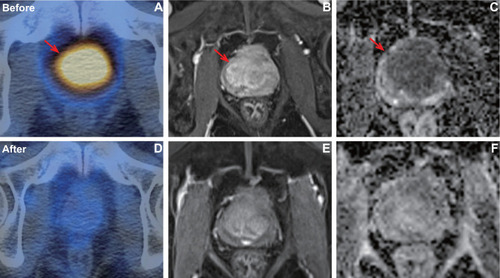
Figure 5 A patient with pathology confirmed prostate cancer of Gleason score 5+4 (T3aN0M0, very high risk) who showed poor response after CIRT. PSMA uptake (A) was visualized on the prostate with TBR of 4.87. After CIRT, the PSMA (D) uptake was still visualized on the prostate (TBR, 3.4). Axial T1 weighted MRI showed the tumor before (B) and after (E) CIRT. In baseline ADC map (C), ADCmean was 0.787× 10⁻³ mm2/s. In post CIRT ADC map (F), ADCmean was 0.812 × 10⁻³ mm2/s.