
Figures & data
Figure 1 Selection of patients for inclusion.
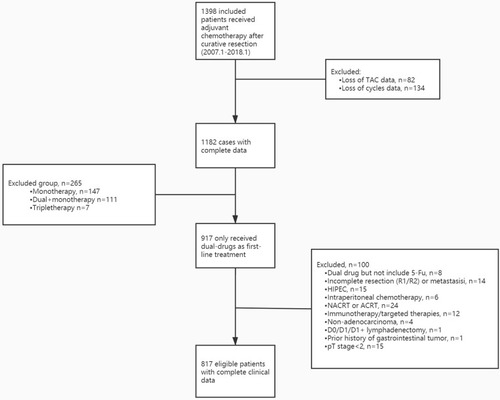
Table 1 Patient Characteristics Categorized by Time to Initiation and Duration of Chemotherapy
Figure 2 (A) Histogram of number of patients received adjuvant chemotherapy after gastrectomy on each waiting time (days). The median is indicated in each case by the vertical dashed line. (B) Bar chart of number of patients adjuvant chemotherapy after gastrectomy on treatment duration (cycles). The median is indicated in each case by the vertical dashed line.
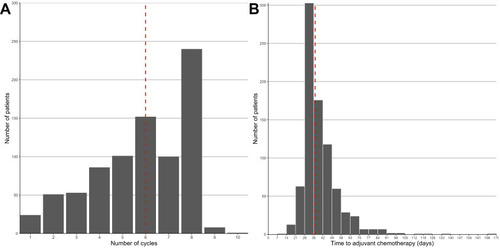
Figure 3 (A) Kaplan–Meier estimates for overall survival by group. (B) Kaplan–Meier estimates for progression-free survival by group.
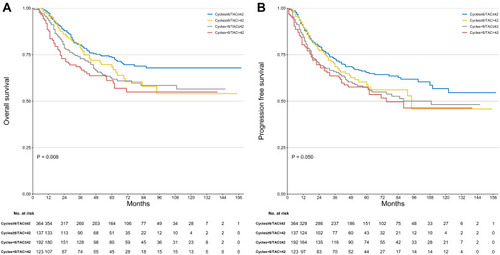
Table 2 Univariate and Multivariate Analyses of Prognostic Factors
Table 3 Multivariate Cox Hazards Regression Model for the Predictable Risk of OS and PFS in Different Covariates Inclusion in Whole Patients
Table 4 Multivariate Cox Hazards Regression Model for the Predictable Risk of OS and PFS in Different Covariate Inclusion in POC Patients
Table 5 Multivariate Cox Hazards Regression Model for the Predictable Risk of OS and PFS in Different Covariate Inclusion in PEC Patients
Figure 4 (A) and (B) Restricted cubic spline functions for the unadjusted relationship between duration (cycles) and OS or PFS. Y-axis demonstrates the unadjusted log hazard of mortality. The greyed ribbon area reflects bounds of the 95% CI. P-values were for non-linear Wald test. Dashed line indicates the relative HR at the cycles of six.
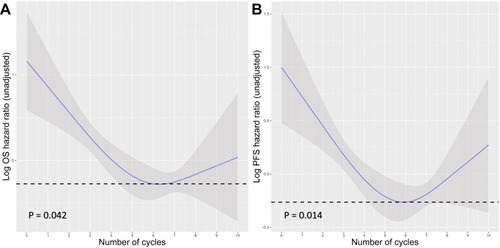
Table 6 Comparison of Treatment-Related Adverse Events Between the Completion and Incompletion Groups