
Figures & data
Table 1 Patient Characteristics at Baseline (n = 43)
Table 2 Patient Characteristics at Baseline Classified by the Advanced Lung Cancer Inflammation Index (n = 43)
Figure 1 Outcomes of receiver operating characteristic (ROC) curve analyses. ROC curve analysis for advanced lung cancer inflammation index (A), C-reactive protein-to-albumin ratio (B) and neutrophil-to-lymphocyte ratio (C).

Figure 2 Kaplan–Meier survival curves of progression-free survival. PFS analysis of all eligible patients (A) PFS analysis of high-ALI group and low-ALI group (B) PFS analysis of low CRP/ALB group and high CRP/ALB group (C) PFS analysis of low NLR group and high NLR group (D).
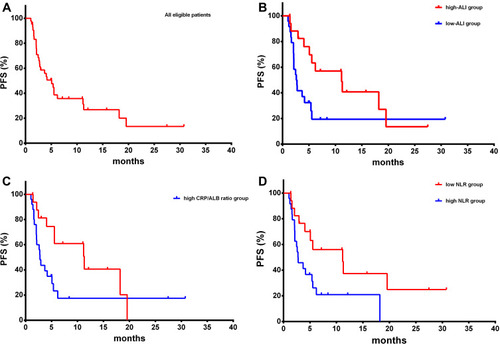
Table 3 Univariate Analyses and Multivariate Analyses for the Response to Immunotherapy