Figures & data
Table 1 Baseline Characteristics of AEG Patients with or without LVI in Unweighted and Weighted Study Population
Table 2 Multivariable Logistic Regression Model Predicting with or Without LVI in the Unweighted Study Population
Figure 1 Unadjusted and IPW-adjusted Kaplan–Meier analysis of disease-specific survival (DSS) and overall survival (OS) in patients with non-metastatic adenocarcinoma of esophagogastric junction after radical surgery. (A) Unadjusted K-M curves for DSS. (B) IPW-adjusted K-M curves for DSS. (C) Unadjusted K-M curves for OS. (D) IPW-adjusted K-M curves for OS.
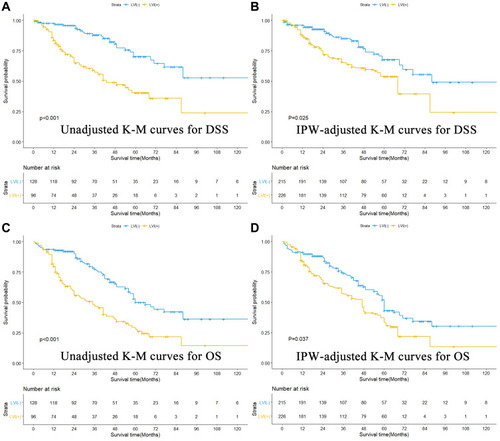
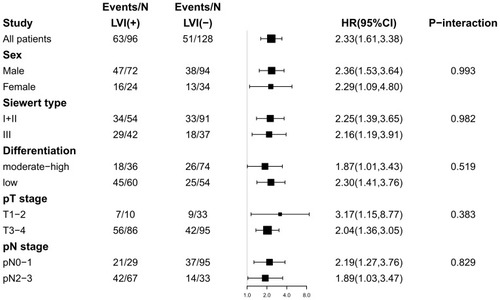
Figure 2 Forrest plot depicting IPW-adjusted HRs of DSS in the group of LVI(+) versus LVI(-) according to baseline covariates.
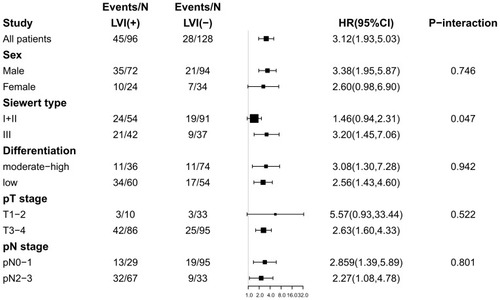
Figure 3 Forrest plot depicting IPW-adjusted HRs of OS in the group of LVI(+) versus LVI(-) according to baseline covariates.