Figures & data
Figure 1 Enhanced computed tomography images. (A) Metastatic tumour of the right testis (arrow); (B) Metastatic tumour of the right spermatic cord (arrow).
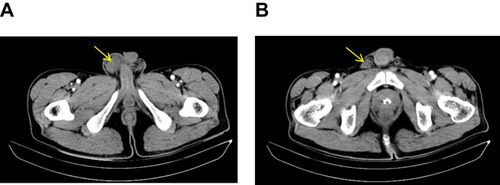
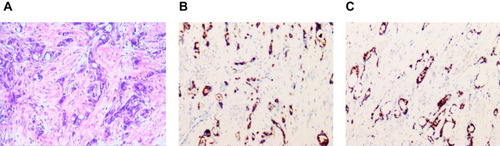
Figure 2 Pathological results of testicular and spermatic cord metastases from gastric adenocarcinoma. (A) Infiltration of adenocarcinoma cells (haematoxylin-eosin staining, original magnification: ×100). (B–C) Immunohistochemistry showed that the tumour cells were positive for pancytokeratin (CK) 8-Auto and CK (L)-Auto.