Figures & data
Table 1 The Demographic and Clinical Characteristics of Patients
Table 2 Selected Features and Corresponding Coefficients for Each Stage by LASSO Algorithm
Figure 1 Feature selection using least absolute shrinkage and selection operator (LASSO) with a binary regression model. (A–C) show the LASSO tuning parameter λ with 10-fold cross-validation for stages I, II, and III, respectively. The misclassification error was plotted versus log(λ). (D–F) show coefficient profiles of stages I, II, and III, respectively. The minimum criteria were chosen to identify the optimal discriminative features and are plotted with a gray vertical line.
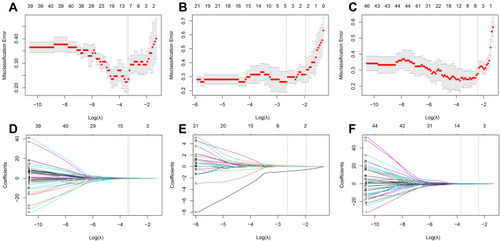
Figure 2 The sum of the absolute coefficients of features with different categories in each stage (A–C) show stages I, II, and III, respectively).
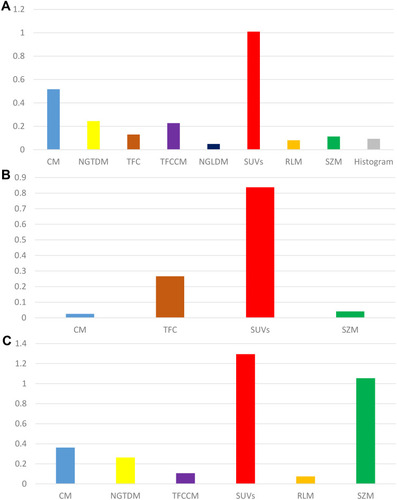
Figure 3 Box plots of the Rad_Score calculated from the training cohort ((A–C) show stages I, II, and III, respectively) and validation cohort ((D–F) show stages I, II, and III, respectively). Red and blue dots are Rad_Score values of each patient in the corresponding cohorts.
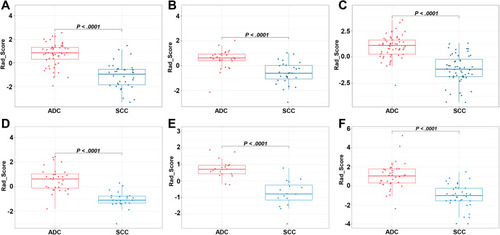
Figure 4 ROC curves were generated to assess the discriminative power of the Rad_Score ((A–C) show stages I, II, and III, respectively) and nomogram ((D–F) show stages I, II, and III, respectively) for predicting the subtype of lung cancer, including ADC and SCC.
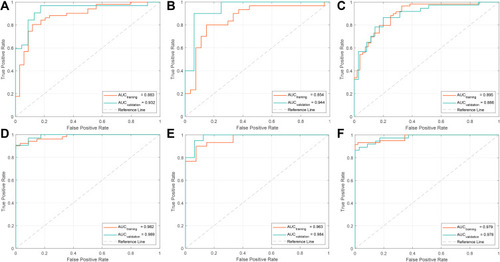
Figure 5 Nomograms developed using the training cohort of stage I (A), II (B), and III (C). The nomogram incorporates the Rad_Score and clinical risk factors.
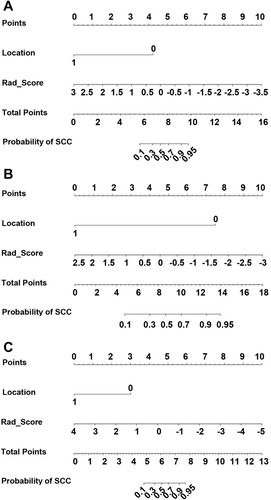
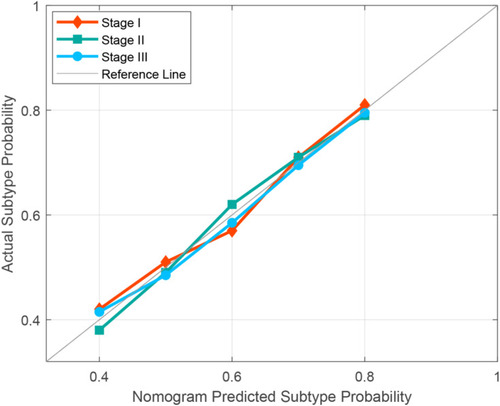
Figure 6 Calibration curves of nomograms were plotted to assess the agreement between the nomograms predicted subtype probability and actual observed subtype probability of the validation cohort.