Figures & data
Figure 1 Low expression of TRIM56 in lung adenocarcinoma is associated with poor prognosis. (A and B) Analysis of TRIM56 expression in GEO datasets. (A) GSE117049 (N=11, T=57), (B) GSE43458 (N=30, T=80). *P<0.05, **P < 0.01. (C) Box plot showing the RNAseq dataset, LUAD tissue (N=515, T=59 in TCGA cohort via UALCAN. **P < 0.01. (D) mRNA of TRIM56 were detected by qRT-PCR in Beas-2B cells and A549 cells. **P < 0.01. (E) The protein levels of TRIM56 in lung adenocarcinoma tissues compared with normal tissues in The Human Protein Atlas database. Normal lung tissue (patient ID: 2268; staining: high; intensity: strong; quantity: >75%), lung Adenocarcinoma sample (patient ID: 3048; staining: Medium; intensity: Moderate; quantity: 75‑25%). (F) TRIM56 expression associated Lung adenocarcinoma patient Overall survival (OS), pre-tumor survival (FPS) and late-stage tumor survival (PPS), data from GSE31210.
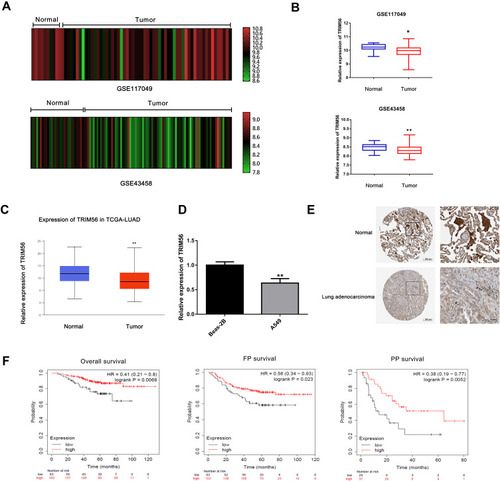
Figure 2 TRIM56 DNA copy number alteration (CNA), mutation and methylation in LUAD. (A) Genetic alteration of TRIM56 in 816 cases of LUAD via cBioportal. (B) Heatmap of TRIM56 mRNA expression, copy number alteration and DNA methylation in patients with primary LUAD. −2: Homozygous deletion; −1: Heterozygous loss, 0: Copy neutral; +1: Low-level copy gain; +2: High-level amplification. Data from GDC TCGA Lung Adenocarcinoma (LUAD) of UCSC (C) Plot chart showing TRIM56 expression in LUAD tissues with copy-number alteration. *P<0.05. (D) Scatter plot showing mutation alteration of TRIM56 in LUAD patients via cBioPortal. ns, no significance. (E) Regression analysis of TRIM56 DNA methylation and TRIM56 expression. (F) Boxplot showing Promoter methylation of TRIM56 from LUAD patients via UALCAN. *P<0.05.
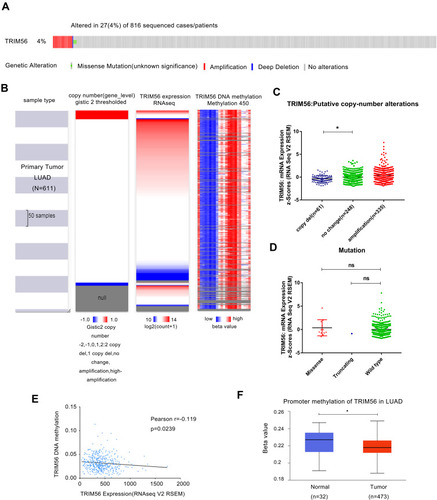
Figure 3 miRNA-TRIM56 network in LUAD. (A) Pearson test was used to analyze correlations between TRIM56 and miRNA differentially expressed in LUAD. (B) Heat maps showing miRNAs negatively correlated with TRIM56 in LUAD (TOP 50). (C–F) Enrichment analysis of the miRNAs negatively correlated with TRIM56 in LUAD. The groups display the enrichment results of the top 30 miRNA that was negatively correlated with TRIM56 in LUAD. (C) Pathway. (D) Biological processes. (E) Molecular functions. (F) Cellular components. (G and H) Kaplan-Meier Plotter was used to analyze the effect of miRNAs expression on the overall survival of LUAD patients: (G) has-mir-542 (H) has-mir-627.
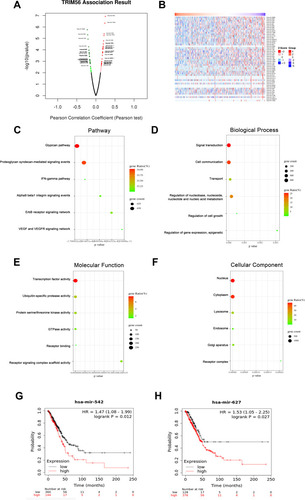
Table 1 Overall Survival of miRNA That Target TRIM56 in LUAD
Table 2 Transcription Factor of TRIM56 in PROMO and ConTra V3
Figure 4 GO Functional Annotation and Pathway Enrichment of TRIM56 interaction proteins (A) Protein-protein interaction network of TRIM56 via STRING. (B–E) Enrichment analysis of the protein interacted with TRIM56. (B) Biological processes (C) Molecular functions. (D) Cellular components. (E) KEGG Pathway.
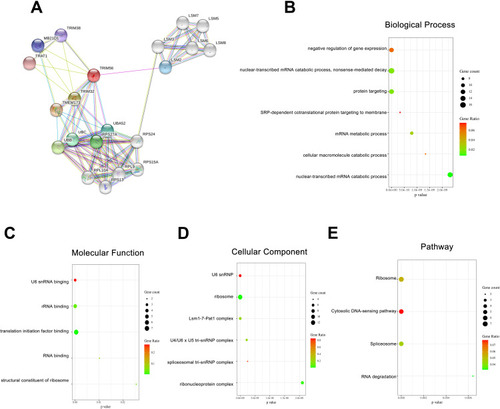
Table 3 Ubiquitination Substrates of TRIM56 in LUAD from UbiBrowser
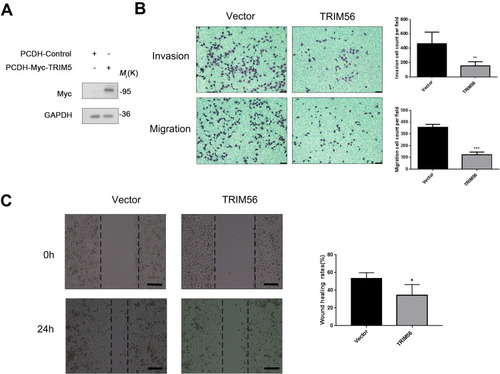
Figure 5 Overexpression TRIM56 could inhibits the invasion and migration of lung adenocarcinoma cells H1299 (A) Western blot confirmed TRIM56 overexpression effect. GAPDH was used as an internal loading control. (B) Cell invasion and migration were examined by transwell assay (scale bar, 200 μm). H1299 cell were cultured in the transwell culture chambers, after incubated 48 h, used crystal violet to stain cells attached to the lower surface of the filter and counted. The quantitative analysis are shown in right panels. The data are presented as the mean ± s.e.m. from three independent experiments. (n = 3). **P < 0.01, ***P < 0.001. (C) Wound healing assay (scale bar, 200 μm) for investigating migration potential of TRIM56 overexpression in H1299 cells. Right histogram represents quantification analysis. The data are presented as the mean ± s.e.m. from three independent experiments. (n = 3). *P < 0.05.