Figures & data
Table 1 The Sequences for Transfection in This Study
Table 2 The Primer Sequences for RT-qPCR in This Study
Figure 1 circCEP128 is highly expressed in bladder cancer tissues and cell lines. (A) The schematic diagram of circCEP128 genomic location. (B and C) The volcano plot and heat map of differentially expressed circRNAs in bladder cancer tissues and adjacent normal tissues based on the dataset of GSE92675. (D) CircCEP128 level in bladder cancer tissues (n=39) and adjacent normal tissues (n=39) was examined via RT-qPCR assay. (E) CircCEP128 level was measured through RT-qPCR assay in T24, 5637 and SV-HUC-1 cells. (F and G) CircCEP128 and linearCEP128 abundances were detected via RT-qPCR assay in T24 and 5637 cells treated with or without RNase R. *P<0.05.
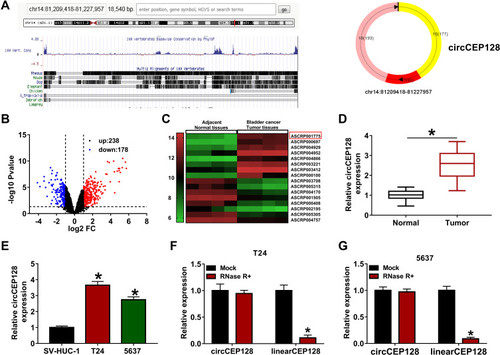
Figure 2 circCEP128 knockdown suppresses cell proliferation, migration and invasion and induces cell apoptosis in bladder cancer. (A and B) circCEP128 abundance was measured via RT-qPCR in cells transfected with si-NC or si-circCEP128. (C and D) Cell proliferation activity was detected via MTT assays in cells transfected with si-NC or si-circCEP128. (E and F) Cell apoptotic rate was measured via flow cytometry in cells after transfection with si-NC or si-circCEP128. (G and H) Cell migratory and invasive abilities were determined using transwell assay in cells after transfection with si-NC or si-circCEP128. (I) Colony formation abilities were determined using transwell assay in cells after transfection with si-NC or si-circCEP128. *P<0.05.
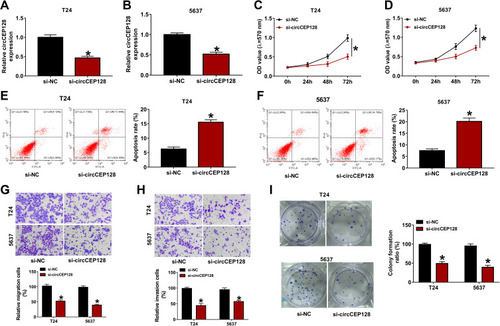
Figure 3 miR-525-5p is a target of circCEP128. (A) MiRNAs that had the possibility to interact with circCEP128 were predicted by circinteractome and circBank database. Common miRNAs in the prediction outcomes of circinteractome and circBank were screened out by Venn analysis. (B and C) miR-1246 and miR-515-5p abundances were examined via RT-qPCR in cells transfected with si-NC or si-circCEP128. (D) Putative binding sequences of circCEP128 and miR-515-5p and mutant sequences in circCEP128 MUT reporter. (E and F) Luciferase activities were detected in T24 and 5637 cells transfected with miR-NC or miR-515-5p mimic and circCEP128 WT or circCEP128 MUT reporter. (G) MiR-515-5p level was examined via RT-qPCR in bladder cancer tumor tissues (n=39) and adjacent normal tissues (n=39). (H) miR-515-5p abundance was examined via RT-qPCR in T24, 5637 and SV-HUC-1 cells. *P<0.05.
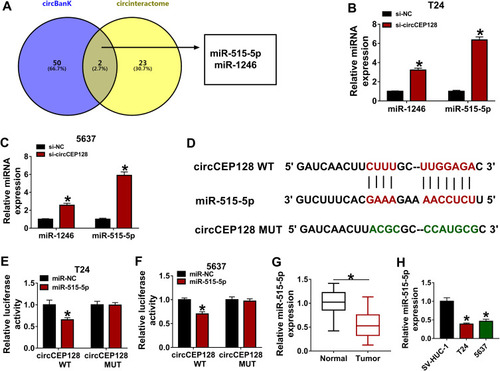
Figure 4 The introduction of miR-515-5p inhibitor weakens the influences of circCEP128 knockdown on cell proliferation, migration, invasion and apoptosis in bladder cancer. T24 and 5637 cells were transfected with si-NC, si-circCEP128, si-circCEP128 + anti-miR-NC or si-circCEP128 + anti-miR-515-5p, followed by the measurement of miR-515-5p expression (A and B), cell proliferative potential (C and D), apoptotic rate (E), migratory ability (F), invasive capacity (G), and colony formation (H). *P<0.05.
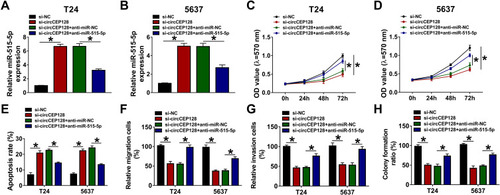
Figure 5 circCEP128 positively regulates SDC1 expression by miR-525-5p. (A) The binding site of miR-515-5p and SDC1 3ʹUTR was predicted by starBase database. Mutant site in SDC1 3ʹUTR MUT reporter. (B and C) Luciferase activities were examined in T24 and 5637 cells transfected with miR-NC or miR-515-5p mimic and SDC1 3ʹUTR WT or SDC1 3ʹUTR MUT. (D) SDC1 abundance was examined via RT-qPCR in bladder cancer tumor tissues (n=39) and adjacent normal tissues (n=39). (E) SDC1 mRNA expression level was examined via RT-qPCR in T24, 5637 and SV-HUC-1 cells. (F) SDC1 expression was determined via Western blot in cells transfected with miR-NC or miR-515-5p mimic. (G) SDC1 protein level was measured by Western blot in cells transfected with si-NC, si-circCEP128, si-circCEP128 + anti-miR-NC or si-circCEP128 + anti-miR-515-5p. *P<0.05.
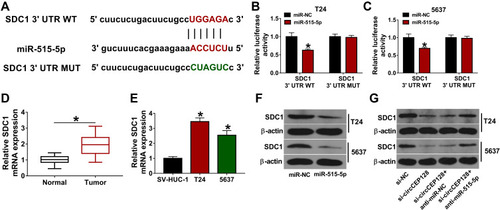
Figure 6 miR-515-5p regulates cell proliferation, migration, invasion and apoptosis via decreasing SDC1 level in bladder cancer. SDC1 expression (A and B), cell proliferation (C and D), apoptosis (E and F), migration (G and H), invasion (I and J), and colony formation (K and L) were detected in T24 and 5637 cells transfected with miR-NC, miR-515-5p mimic, miR-515-5p mimic + vector or miR-515-5p mimic + SDC1 overexpression vector. *P<0.05.
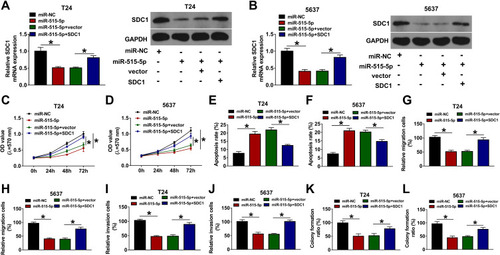
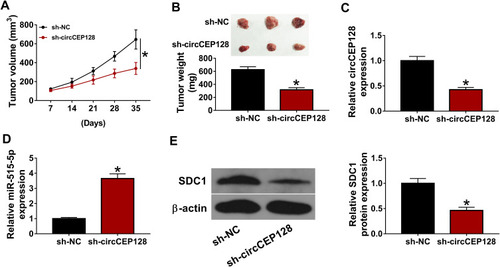
Figure 7 circCEP128 knockdown inhibits the growth of bladder cancer xenograft tumors by up-regulating miR-515-5p and down-regulating SDC1. The xenograft model was established using 5637 cells stably transduced with sh-NC or sh-circCEP128 lentiviruses. (A and B) Tumor volume and weight were examined. (C–E) circCEP128, miR-515-5p and SDC1 abundances in xenograft tumors were determined by RT-qPCR and Western blot assays. *P<0.05.