Figures & data
Figure 1 Flowchart for patient selection.
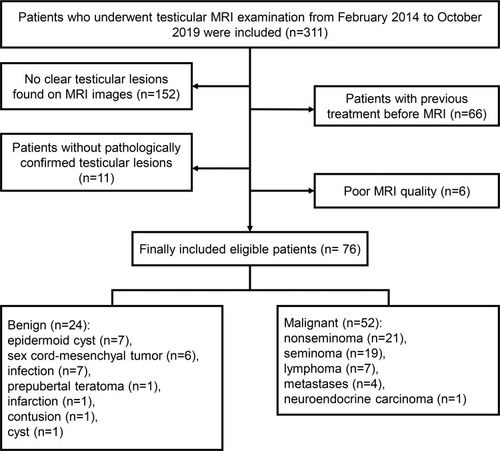
Table 1 MRI Protocol for Testicular Examination
Figure 2 Flowchart of feature extraction. (A) All patients underwent preoperative magnetic resonance imaging. (B) Testicular lesions were delineated by stacking regions of interest (ROI) slice-by-slice on the transverse T2-weighted images. (C) The Ipris and histogram features were extracted from T2WI by Python software and IF software, respectively.
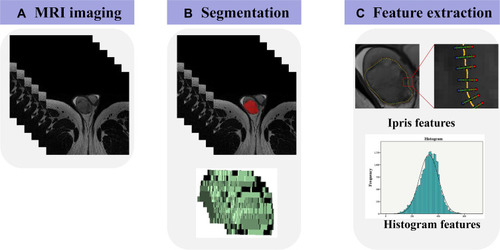
Figure 3 The distribution of intra- and interobserver intraclass correlation coefficients (ICCs) values for all the Ipris and histogram features (A and B).
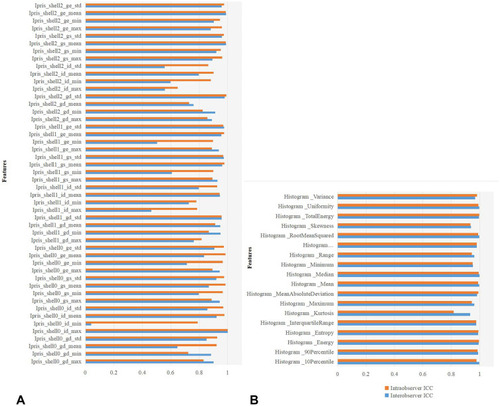
Table 2 Diagnostic Performance of the 12 Selected Features
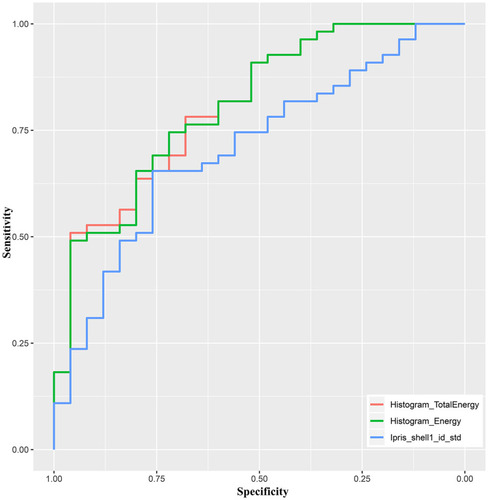
Figure 4 Receiver operating characteristic curves of the top three features for distinguishing between benign and malignant testicular lesions.