Figures & data
Table 1 The Clinical Parameters of the Studied CC Patients
Figure 1 Expression level of LINC01224 in CC tumor tissues and several cell lines. (A) Expression levels of LINC01224 in several colon cancer cell lines (HCT116, HT-29, SW620 and SW480) and control NCM460 cells were detected by qRT-PCR. (B) Expression levels of LINC01224 in colon cancer tumor tissues and adjacent normal tissues were detected by qRT-PCR. (C) Kaplan–Meier survival curves for patients with colon cancer were plotted according to high or low LINC01224 expression level. **p < 0.01. ***p < 0.001.
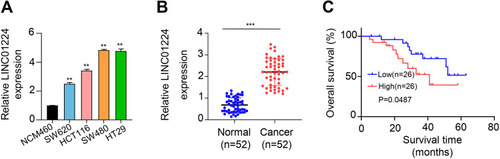
Figure 2 Knockdown of LINC01224 suppressed proliferation, migration and invasion of CC cells. (A) qRT-PCR revealed that si-RNA LINC01224#1 or si-RNA LINC01224#2 effectively suppressed the level of LINC01224 in HT29 and SW480 cells. (B) CCK-8 assay illustrated that LINC01224 knockdown significantly suppressed the OD 450 values at 72 h in HT29 and SW480 cells (C) Colony formation assay showed that LINC01224 knockdown significantly decreased the colony numbers as compared with si-NC group. (D) Transwell assays demonstrated that LINC01224 knockdown significantly suppressed migration ability of HT29 and SW480 cells. (E) Transwell assays demonstrated that LINC01224 knockdown significantly suppressed invasion ability of HT29 and SW480 cells. (F and G) LINC01224 knockdown markedly suppressed tumor volume and weight. **p < 0.01. ***p < 0.001.
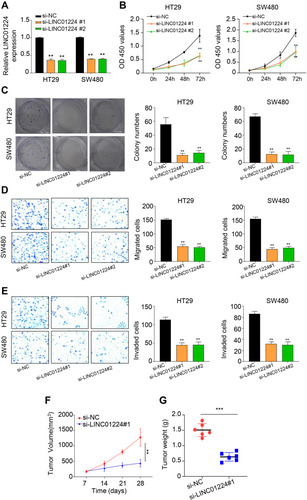
Figure 3 LINC01224 acts as a sponge for miR-485-5p. (A) Starbase online database predicted a binding site of miR-485-5p in LINC01224 sequence. (B) Dual-luciferase reporter assay was used to evaluate the interaction between miR-485-5p and LINC01224. The results showed that miR-485-5p overexpression markedly suppressed the luciferase activity of H293T cells in LINC01224 widetype (WT) group, but not work in LINC01224 mutant (Mut) group. (C) The binding of LINC01224 to miR-485-5p detected by RNA pull-down. RNA pull-down assay found a significant enrichment of miR-485-5p with bio-LINC01224, compared with input control. (D) qRT-PCR revealed that miR-485-5p levels were markedly up-regulated in si-LINC01224 pool group cells, compared with levels observed in si-NC pool group. (E) qRT-PCR detected that the expression level of miR-485-5p in colon cancer tumor tissues and adjacent normal tissues. The expression level of miR-485-5p was lower in CC tumor tissues than that in normal tissues. **p < 0.01.
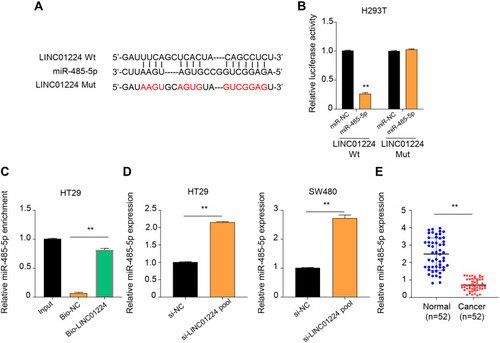
Figure 4 Interaction between MCL1 and miR-458-5p. (A) Starbase online database predicted that a binding site of miR-458-5p in MCL1 sequence. (B) Dual-luciferase reporter assay was used to evaluate the interaction between miR-485-5p and MCL1. The results showed that MCL1 WT reporter was strongly inhibited by miR-485-5p, whereas MCL1 Mut reporter was not affected by miR-485-5p. (C and D) The mRNA and the protein levels of MCL1 in HT29 and SW480 cells were markedly inhibited in miR-485-5p mimics groups. (E) qRT-PCR results revealed that the level of MCL1 was obviously higher in CC tumor tissues than that in normal tissues. **p < 0.01.
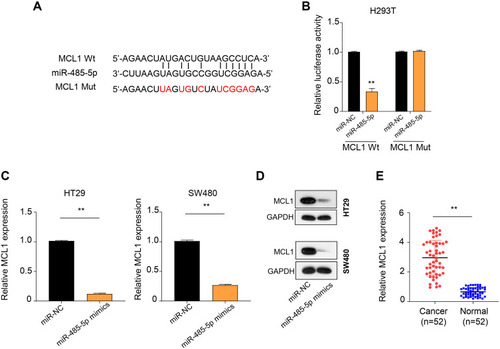
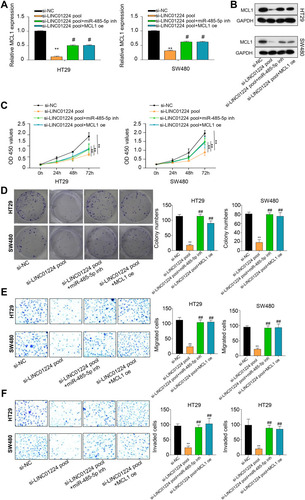
Figure 5 LINC01224 inhibited MCL1 expression by sponging miR-455-5p. (A and B) In HT29 and SW480 cell lines, si-LINC01224 pool markedly suppressed the mRNA and protein level of MCL1, whereas miR-485-5p inhibitor (miR-485-5p inh) or MCL1 overexpression (MCL1 oe) restored the effects of si-LINC01224 pool. (C–F) CCK-8 assay, colony formation assay, transwell assays with Matrigel displayed that miR-485-5p inh or MCL1 oe markedly restored the repressive effect of si-LINC01224 pool on the cell proliferation (C), cell lone formation (D), cell migration (E) and invasion (F). **p < 0.01 versus si-NC group. #p < 0.01, ##p < 0.001 versus si-LINC01224 pool group.