Figures & data
Table 1 Primers and Oligonucleotides Used in This Study
Figure 1 CircSND1 is up-regulated by TNF-α in CC cells. (A) The dysregulated 161 circRNAs identified from the TNF-α treated HeLa cells by deep sequencing. (B) The expression of the 11 selected circRNAs were detected by RT-qPCR. (C) CircSND1 forms a circular structure through exons 8, exons 9 and exons10 in SND1 gene. The back-splice junction sequence of circSND1 was proved by Sanger sequencing. (D) cDNA and gDNA of HeLa cells were used as the templates to amplify circSND1 and GAPDH with divergent primers and convergent primers, respectively. GAPDH was served as the negative control. (E) The abundances of circSND1 and SND1 mRNA in CC cells treated with RNase-R were verified by RT-qPCR. (F) The RNA expression of circSND1 and SND1 mRNA of CC cells were examined by RT-qPCR after treatment with actinomycin D at the indicated time points. (G) Nuclear-cytoplasmic fractionation assay showed that circSND1 was mainly localized in the cytoplasm of CC cells. β-Actin was known as a cytoplasmic house-keeping gene. U6 was known as a nucleus house-keeping gene. (H) Wild type (WT) and mutant (mut) sequences of three predicted binding sites of p65 on SND1 promoter were shown. (I) The luciferase activity of the circSND1-P or circSND1-P-mut with and without TNF-α treatment. (J) The luciferase activity of the circSND1-P or circSND1-P-mut after overexpression of p65. (K) RT-qPCR results showed that overexpression of p65 increased the levels of mSND1 and circSND1. (L) The expression level of circSND1 was detected by RT-qPCR assays after HeLa cells were treated with TNF-α (60ng/mL), BAY 11–7082 (25μM), or TNF-α in the absence or presence of BAY 11–7082. Experiments were performed 3 times, and data are presented as means ± SD. *P <0.05; **P <0.01; ***P <0.001.
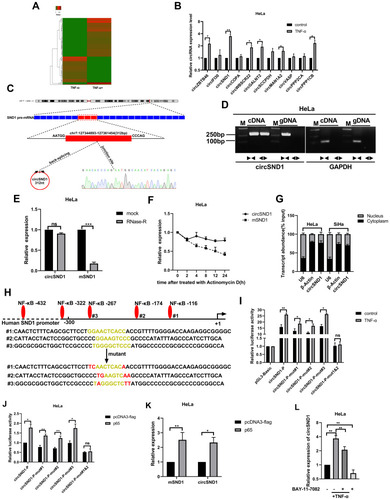
Figure 2 CircSND1 enhances migration and invasion of CC cells in vitro. (A) Validation of circSND1 overexpression and knockdown plasmid by RT-qPCR in CC cells. # means serial number. (B, C) Transwell assays showed that overexpression of circSND1 promoted cell migration and invasion; and knockdown of circSND1 inhibited cell migration and invasion. Scale bar: 100 μm. (D) The cell viability of HeLa and SiHa cells in the presence of circSND1 overexpression and pshR-circSND1 was measured at 24–72h post-transfection by using an MTT assay. (E) The cell growth capacity was assessed by colony formation assay in HeLa and SiHa cells. (F) Western blotting assessed the protein level of key molecular markers associated with EMT (E-cadherin and vimentin) in HeLa and SiHa cells when overexpression of circSND1. (G) Western blotting assay showed the effect of overexpression of circSND1 on the protein level of the HPV E6/E7 oncogenes. Experiments were performed 3 times, and data are presented as means ± SD. *P <0.05; **P <0.01; ***P <0.001.
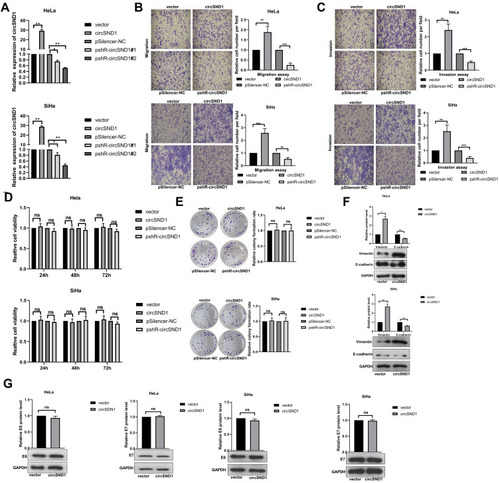
Figure 3 CircSND1 serves as miR-125-3p sponge in CC cells. (A) Schematic illustration showed the potential target miRNAs that bound to circSND1 as predicted by circbank and RegRNA2.0. (B) The predicted binding sites of miR-125a-3p (middle) with the wild-type (top) and mutated (bottom) circSND1. (C) The EGFP protein level of HeLa cells co-transfected with wild-type or mutant pcDNA3/EGFP- circSND1-3′UTR with miR-125a-3p or ASO-miR-125a-3p were detected. (D) RT-qPCR determined the expression of endogenous miR-125a-3p while overexpression and knockdown circSND1. (E, F) The migration and invasion ability of CC cells was detected after transfection with the corresponding plasmid. (G) Western blotting assessed the protein level of key molecular markers of EMT in CC cells when overexpression of miR-125a-3p. Experiments were performed 3 times, and data are presented as means ± SD. *P <0.05; **P <0.01; ***P <0.001.
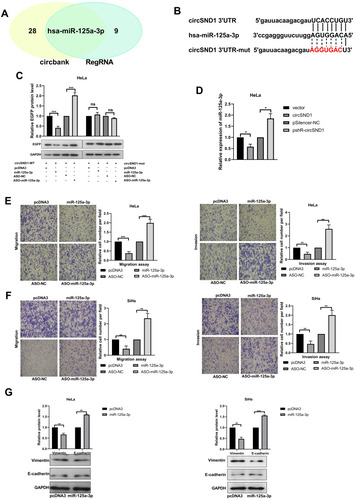
Figure 4 FUT6 is a direct target of miR-125a-3p and enhances the migration and invasion in cervical cancer cells. (A) The schematic showed potential miR-125a-3p binding sites and mutation sites in FUT6 3’UTR. (B) Western blotting detected the EGFP protein level in HeLa cells after co-transfection with the corresponding plasmid. (C) The mRNA and protein levels of endogenous FUT6 were detected when overexpression and knockdown miR-125a-3p. (D) The migration and invasion ability of CC cells was detected after transfection with overexpression plasmids (pcDNA3-flag/FUT6) and knockdown plasmids (pshR-FUT6) respectively. (E) Western blotting assessed the protein level of key molecular markers of EMT in CC cells when overexpression FUT6. (F) The migration and invasion ability of CC cells after co-transfection of FUT6 and miR-125a-3p. (G) Western blotting assessed the protein level of key molecular markers of EMT in CC cells after FUT6 transfection in the presence of miR-125a-3p. Experiments were performed 3 times, and data are presented as means ± SD. *P <0.05; **P <0.01; ***P <0.001.
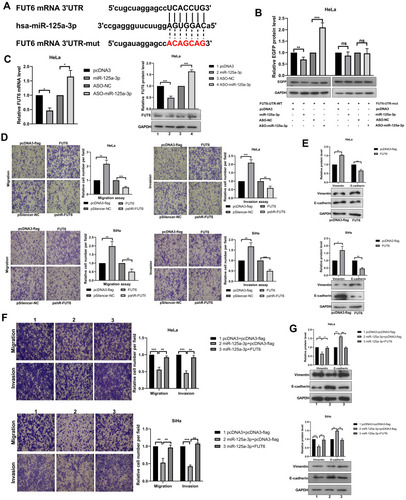
Figure 5 CircSND1 promotes the progression of CC via the circSND1/miR-125a-3p/FUT6/NF-κB axis. (A) The mRNA and protein expression of endogenous FUT6 were detected with overexpression and knockdown of circSND1. (B) The expression of FUT6 was detected by RT-qPCR and Western blotting in HeLa cells after co-transfection with circSND1 and miR-125a-3p. (C) The migration and invasion ability of CC cells was detected after co-transfection with the corresponding plasmid. (D) Western blotting assessed the protein level of key molecular markers of EMT in CC cells after miR-125a-3p transfection in the presence of circSND1. (E) Confocal image of Flag/p65 (red) and FUT6 (green) in HeLa cells, cell nuclei were stained with DAPI (blue). Scale bars, 5 μm. (F) p65 protein levels in whole cell lysate, cytosol and nucleus were analyzed by Western blot. Experiments were performed 3 times, and data are presented as means ± SD. *P <0.05; **P <0.01; ***P <0.001.
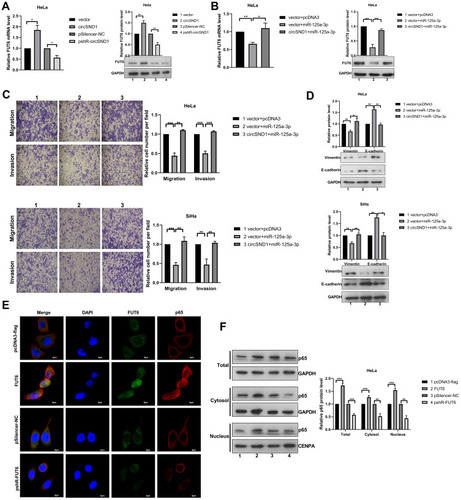
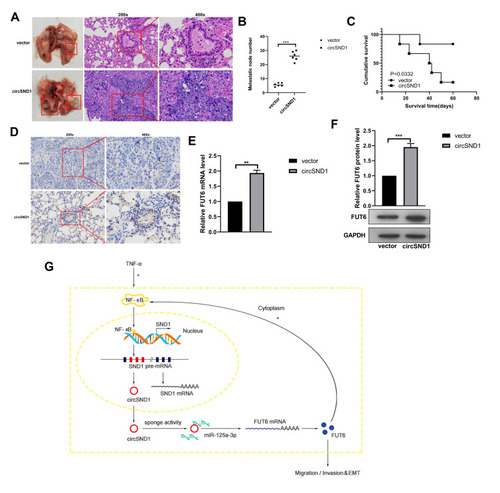
Figure 6 CircSND1 accelerates metastasis of xenograft tumors in vivo. (A) H&E staining of the lungs was shown and in vivo tail vein injection model confirmed that overexpression of circSND1 could significantly promote metastasis of CC cells to lungs. (B) Number of metastatic nodules in lung were presented. (C) The survival curve of the nude mice injected with HeLa cells stably expressing circSND1 and empty vector. (D) Representative IHC images showed the levels of FUT6 expression in xenograft tumor tissues. (E, F) RT-qPCR and Western blotting detected the level of FUT6 in xenograft tumor tissues. (G) The schematic showed that circSND1 promoted the ability of migration/invasion and the process of EMT in CC cells through TNF-α/NF-κB/circSND1/miR-125a-3p/FUT6/NF-κB axis. Experiments were performed 3 times, and data are presented as means ± SD **P <0.01; ***P <0.001.