Figures & data
Figure 1 Microarray assay result of GSE126094.
Notes: (A) The total expression level of circRNAs after normalization. (B) The heatmap of differentially expressed circRNAs. (C) The expression level of hsa_circ_0043278 in samples from GSE126094. The expression level of hsa_circ_0043278 was decreased in tumor samples.
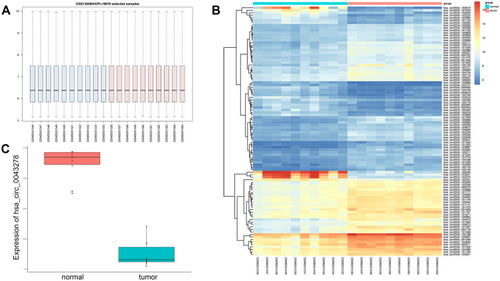
Figure 2 Sanger sequencing result of hsa_circ_0043278.
Notes: (A) Sanger sequencing result of hsa_circ_0043278. The arrow shows the back-splicing junction. (B) Electrophoresis result of the amplified product with divergent primers. The size of amplified product was 115 bp. (C) The illustration of hsa_circ_0043278 with convergent primers. Hsa_circ_0043278 is from exon 5 and exon 6 of TADA2A with the size of 250 bp. The forward primer contains a sequence of splice sites.
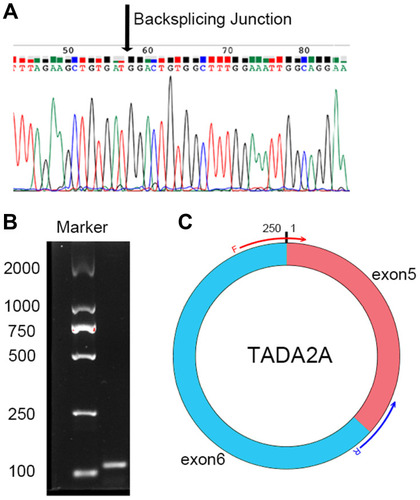
Figure 3 The expression level of hsa_circ_0043278 in colorectal cancer tissues and cell lines.
Notes: (A) The expression level of hsa_circ_0043278 in 43 paired colorectal cancer tissues and corresponding adjacent normal tissues. (B) The expression level of hsa_circ_0043278 in colorectal cancer cell lines (HCT116, SW620, and SW480) compared with normal colonic epithelial cell lines NCM460. Hsa_circ_0043278 was downregulated in colorectal cancer cell lines. (C) The ROC curve. The area under the curve was 0.71 (P = 0.0006). All the data are presented as mean ± SD of 3 independent experiments. Asterisks indicate P-values that are significant (*P < 0.05, **P < 0.01, ****P < 0.0001).
Abbreviations: Cq, cycle quantification; GAPDH, glyceraldehyde-3-phosphate dehydrogenase; ROC, receiver operating characteristic; AUC, area under the curve.
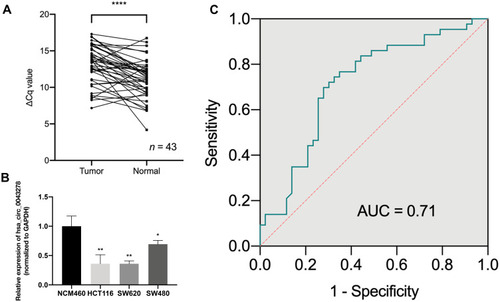
Table 1 The Association Between Hsa_circ_0043278 and Clinicopathological Factors in CRC Patients
Figure 4 Hsa_circ_0043278 inhibits colorectal cancer cell proliferation.
Notes: (A) Left, the expression level of hsa_circ_0043278 after transfecting overexpression plasmid. Right, the expression level of hsa_circ_0043278 after transfecting small interfering RNAs. (B) Left, the expression level of TADA2A after transfecting overexpression plasmid. Right, the expression level of TADA2A after transfecting small interfering RNAs. (C and D) The result of cell counting kit-8 assay. (E and F) The result of colony formation assay. Hsa_circ_0043278 overexpression significantly inhibited proliferation and reduced the numbers of CRC cell colonies compared to those in the negative control groups. Hsa_circ_0043278 inhibition promoted proliferation and increased the number of CRC cell colonies. All the data are presented as mean ± SD of three independent experiments. Asterisks indicate P-values that are significant (*P < 0.05, **P < 0.01, ***P < 0.001, ****P < 0.0001). ns indicates P-values that are not significant.
Abbreviations: siRNA, small interfering RNA; NC, negative control.
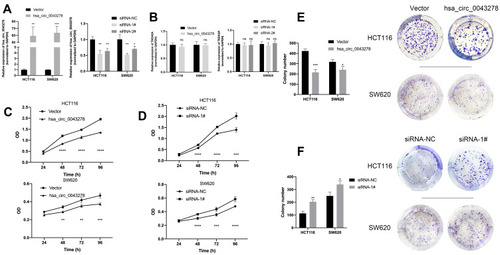
Figure 5 Hsa_circ_0043278 promotes colorectal cancer cell apoptosis.
Notes: (A) The apoptosis level of HCT116 and SW620 after transfecting overexpression plasmid. (B) The apoptosis level of HCT116 and SW620 after transfecting small interfering RNAs. Hsa_circ_0043278 overexpression promoted apoptosis of both HCT116 and SW620 cells while hsa_circ_0043278 inhibition suppressed apoptosis of the cells. All the data are presented as mean ± SD of three independent experiments. Asterisks indicate P-values that are significant (*P < 0.05, ***P < 0.001, ****P < 0.0001).
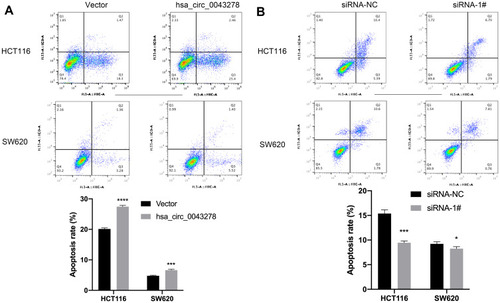
Figure 6 Hsa_circ_0043278 affects colorectal cancer cell cycle.
Notes: (A) Hsa_circ_0043278 overexpression blocked HCT116 and SW620 cells in the G0/G1 phase. (B) HCT116 and SW620 were arrested in the S phase by hsa_circ_0043278 inhibition. All the data are presented as mean ± SD of three independent experiments. Asterisks indicate P-values that are significant (**P < 0.01, ***P < 0.001).
Abbreviation: OE, overexpression.
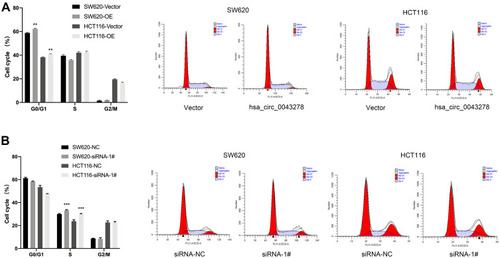
Figure 7 Hsa_circ_0043278 inhibits colorectal cancer cell migration.
Notes: (A) The number of hsa_circ_0043278 overexpressing HCT116 and SW620 cells on the membrane of the chamber was decreased than that in the negative control group. (B) The number of HCT116 and SW620 cells on the membrane in the groups transfected with hsa_circ_0043278 siRNA was increased. All the data are presented as mean ± SD of three independent experiments. Asterisks indicate P-values that are significant (**P < 0.01, ****P < 0.0001).
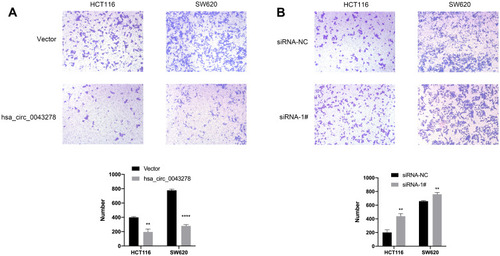
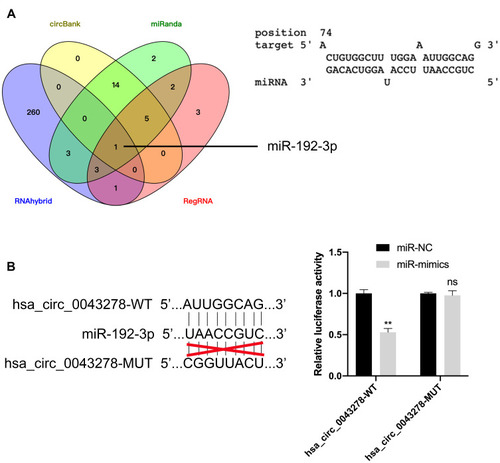
Figure 8 Hsa_circ_0043278 sponges with miR-192-3p.
Notes: (A) Left, the Venn diagram that suggests miR-192-3p could sponged by hsa_circ_0043278. Right, the sequence of predicted binding site. (B) Left, the wildtype and mutant sequence of hsa_circ_0043278. Right, the relative luciferase activity of 293T cells was significantly decreased in cells transfected with hsa_circ_0043278 wildtype sequence and miR-192-3p mimics than mutant sequence. All the data are presented as mean ± SD of three independent experiments. Asterisks indicate P-values that are significant (**P < 0.01). ns indicates P-values that are not significant.
Abbreviations: WT, wildtype; MUT, mutant.