
Figures & data
Table 1 Clinicopathological Characteristics of 136 Patients Enrolled
Figure 1 Flow chart of patient enrolment.
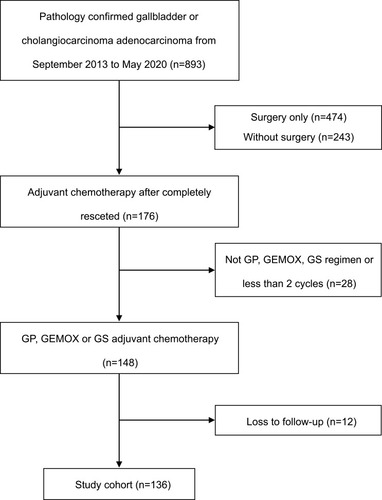
Table 2 Univariate Analysis of Clinicopathological Factors Associated with RFS
Table 3 Multivariate Cox Proportional Hazards Model of RFS
Figure 2 Kaplan–Meier Curves of RFS based on chemotherapy regime.
Abbreviations: GP, gemcitabine plus cisplatin; GEMOX, gemcitabine plus oxaliplatin; GS, gemcitabine plus S-1; RFS, relapse-free survival.
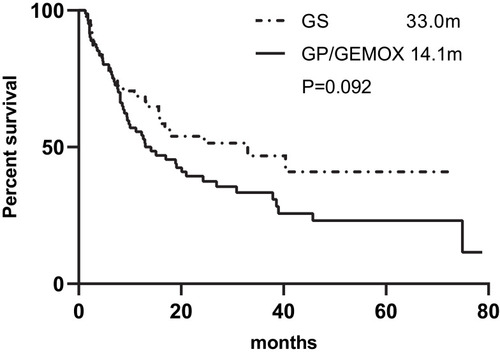
Figure 3 Kaplan–Meier Curves of RFS based on lymph node involvement (A) and chemotherapy cycles (B).
Abbreviations: N-, lymph node negative; N+, lymph node negative; RFS, relapse-free survival.
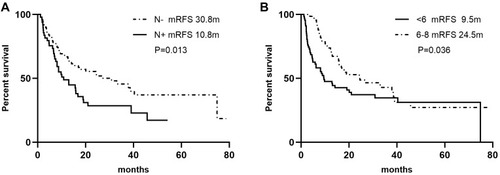
Figure 4 Landmark analysis based on chemotherapy cycles.
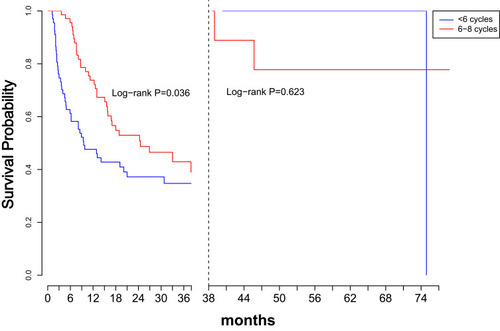
Figure 5 RFS benefits of different chemotherapy regimens in subgroups.
Abbreviations: ECOG PS, Eastern Cooperative Oncology Group performance status; GP, gemcitabine plus cisplatin; GEMOX, gemcitabine plus oxaliplatin; GS, gemcitabine plus S-1; N-, lymph node negative; N+, lymph node negative.
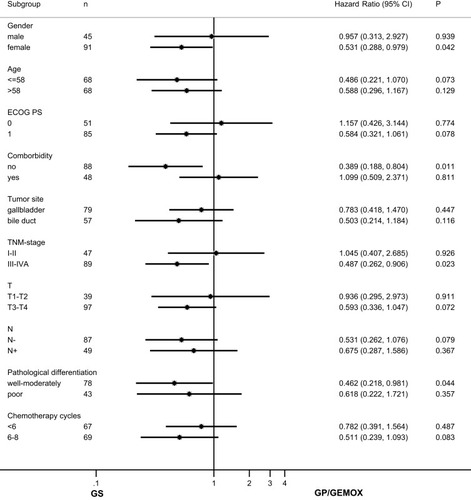
Table 4 Treatment-Related Adverse Events