
Figures & data
Table 1 Demographics and Characteristics of the Study Population
Figure 1 Each colored circle represents a specific discriminative model (176 models in total) with different combinations of classifier and feature selection methods. A dedicated color is assigned to each circle with respect to the feature type that has the highest AUC value among all the 15 feature types for the corresponding discriminative model.
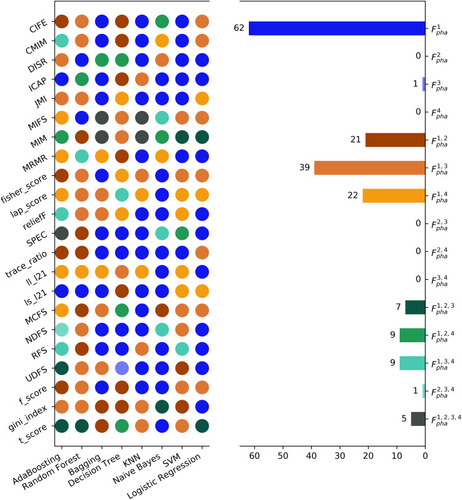
Figure 2 Boxplots of the AUC distributions for all the 15 feature types. The boxes run from the 25th percentile to the 75th percentile; the two ends of the whiskers represent the 5% and 95% percentiles of the data, and the horizontal line and the square in the box represent the median and mean values, respectively. The diamonds represent outliers. The letters above each box indicate whether a statistically significant difference (by Kruskal–Wallis test with Bonferroni correction) exists between any two feature types. No common letters indicate that the two feature types are significantly different.
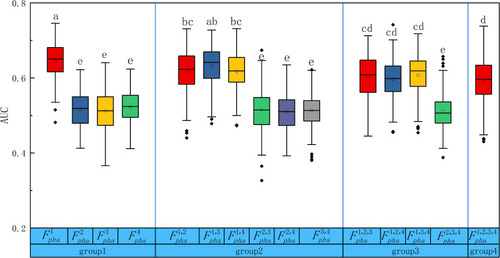
Figure 3 A heatmap representation of the AUC values obtained by the 176 discriminative models (F_pha^1 as feature input) built with different combinations of classifiers and feature selection methods.
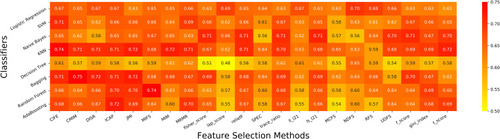
Figure 4 A pie chart showing the number of times (%) the features in F_pha^1 were selected into the top-20 features in the five-fold cross-validation of all discriminative models with AUCs >0.6. The most frequent 10 features are highlighted with underlined font.
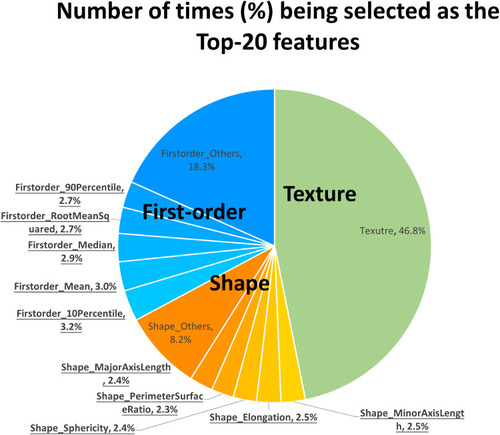
Table 2 The Top-10 Most Frequently Selected Features in , Their Corresponding Mean (±SD) Values (or Median (IQR)) and the P-values Between Low and High Fuhrman Grades