Figures & data
Figure 1 The flow chart of selected patients.
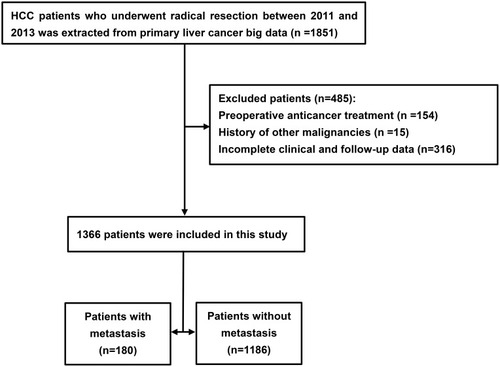
Table 1 The Optimal Cut-Off Value for NLR, PLR, LMR, PNI, and NγLR Calculated by the ROC Curve
Table 2 Comparison of Clinicopathological Characteristics Between Metastasis and Non-Metastasis
Table 3 Univariate and Multivariate Cox Regression for Extrahepatic Metastasis in HCC Patients After Radical Resection
Figure 2 Comparison of metastasis rate between high and low PLR groups.
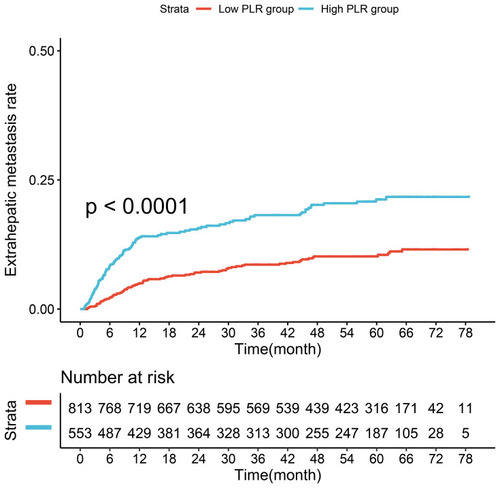
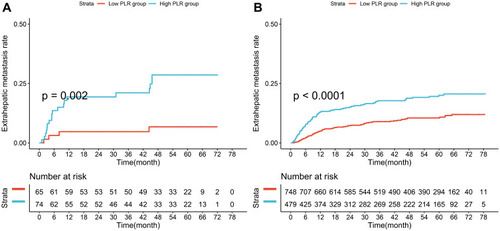
Figure 3 Subgroup analysis of metastasis rate between high and low PLR groups. (A) Metastasis rate in the BCLC stage 0/A patients; (B) metastasis rate in the BCLC stage B patients.
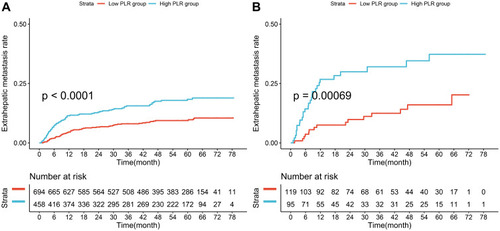
Figure 4 Subgroup analysis of metastasis rate between high and low PLR groups. (A) Metastasis rate in the normal AFP level group (<20ng/mL); (B) metastasis rate in the abnormal AFP level group (≥20ng/mL and <400ng/mL); (C) metastasis rate in the higher AFP level group (≥400ng/mL).
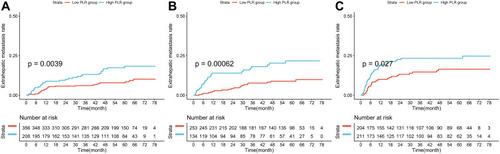
Figure 5 Subgroup analysis of metastasis rate between high and low PLR groups. (A) Metastasis rate in the non-cirrhosis group; (B) metastasis rate in the cirrhosis group.
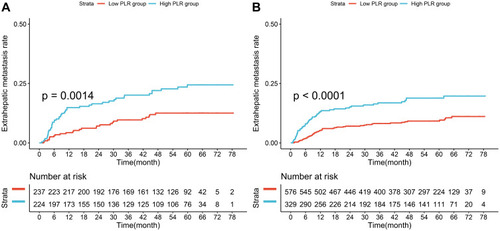
Figure 6 Subgroup analysis of metastasis rate between high and low PLR groups. (A) Metastasis rate in the HBsAg negative group; (B) metastasis rate in the HBsAg positive group.