Figures & data
Figure 1 Specimen removal and gastrointestinal reconstruction of low rectal cancer in NOSES group. (A) Cut and closed sigmoid colon. (B) The specimen was pulled out of the body through the anus. (C) Cut through the rectal wall. (D) Sent the nail base into the pelvic cavity through the anus. (E) The specimen was resected by means of kaito. (F) Cut the wall of sigmoid colon and sterilize it. (G) The nail base was placed into the proximal sigmoid colon. (H) Closed sigmoid wall. (I) Removed the connecting rod of the nail seat. (J) An end-to-end anastomosis was performed. (K) Bilateral drainage tube was inserted. (L) Postoperative abdominal wall of the patient.
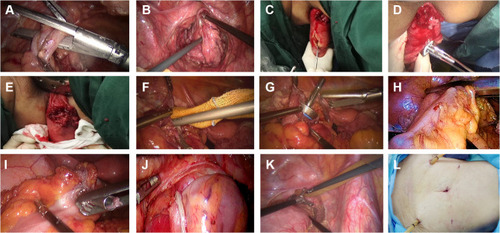
Table 1 Baseline Information for Two Groups of Patients
Table 2 Comparison of Postoperative Conditions Between the Two Groups
Figure 2 Comparison of ASA scores between two groups of patients after operation. The P-value was calculated by repeated measures statistical analysis.
Table 3 Postoperative Wexner Scores in Both Groups
Figure 3 Comparison of standard scores of body image scales and cosmetic scales between two groups. ***P<0.001.
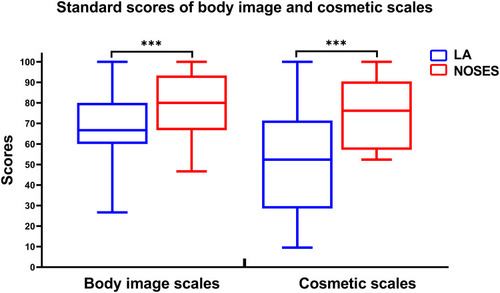
Figure 4 Comparison of EORCT Quality of Life Questionnaire-Core 30 results between the two groups. The results of the questionnaire were presented by a functional scale (A) and a symptom scale (B). *p<0.05, **p<0.01, ***p<0.001.
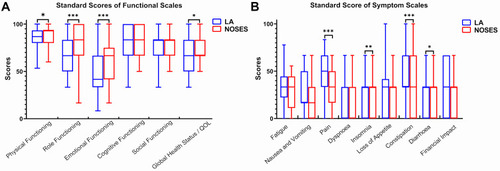
Figure 5 Comparison of postoperative Wexner scores between the two groups.
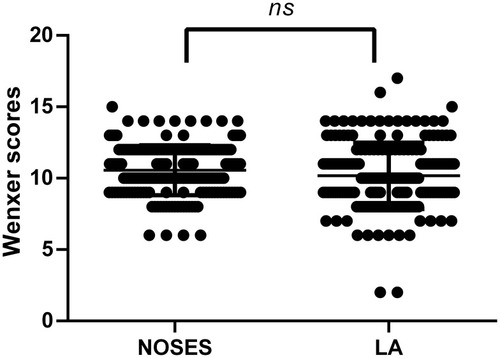
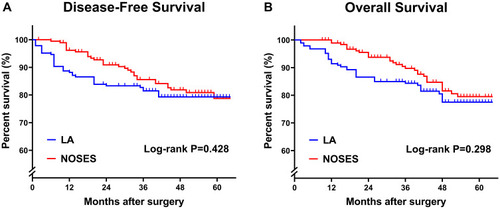
Figure 6 Kaplan–Meier curves comparing the differences between the two groups in terms of disease-free survival (A) and overall survival (B). P-value is calculated by Log rank test.