Figures & data
Figure 1 PPM synthesis process diagram. (A) Water and oil mixture were stirred to form inverse emulsion. Polysaccharide large emulsion droplets were evenly dispersed in the oil phase. (B) The crosslinker CaCl2 solution was added to the emulsion and formed tiny emulsion droplets. A crosslinking reaction was performed between polysaccharide droplets and tiny crosslinker droplets. (C) After freezing and drying, PPMs were finally obtained.
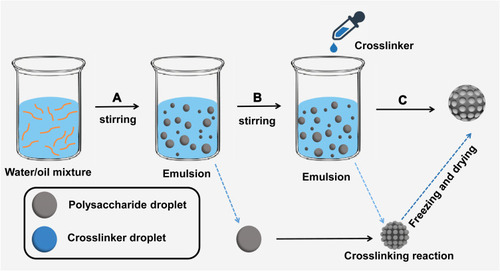
Figure 2 Fourier transform infrared (FT-IR) spectroscopy of PPM and PPM/MMC (MMC-loaded PPM).
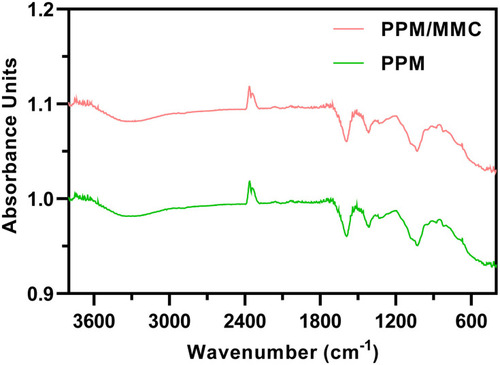
Table 1 Average Size and Zeta Potential of PPM and MMC-Loaded PPM Obtained by Particle Analyzer
Figure 3 Scanning electron microscope analysis morphology of (A) PPM and (B) MMC-loaded PPM.
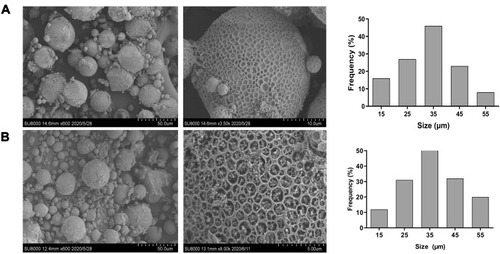
Figure 4 (A) Drug release results of the free MMC and MMC-loaded PPM at different pH. $p<0.05, compared with free MMC group at pH 6.5. **p<0.01, compared with free MMC group at pH 6.5. #p<0.05, compared with PPM/MMC group at pH 6.5; ##p<0.01, compared with free MMC group at pH 7.4. (B) Cell viability rate of A549 co-cultured with free MMC, MMC-loaded PPM and free PPM at different concentrations for 24 h was assessed by CCK-8. **p<0.01, ***p<0.001 and ****p<0.0001, compared with control group (0 μg/mL); #p<0.05, ##p<0.01 and ###p<0.001, compared with free MMC group.
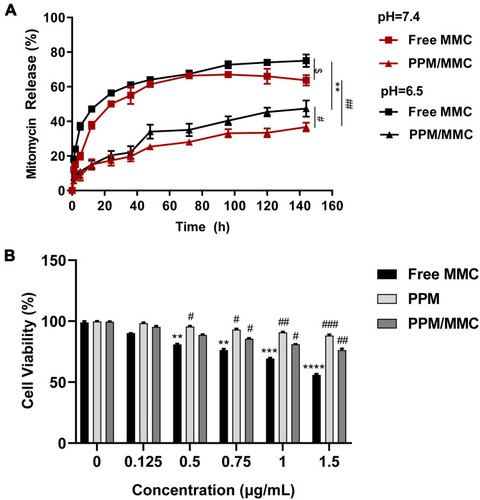
Figure 5 (A) Apoptosis experiment results of A549 co-cultured with free MMC for 24 h at different concentrations. (B) Apoptosis experiment results of A549 co-cultured with PPM alone for 24 h at different concentrations. (C) Apoptosis experiment results of A549 co-cultured with MMC-loaded PPM for 24 h at different concentrations. *p<0.05 and ***p<0.001, compared with control group.
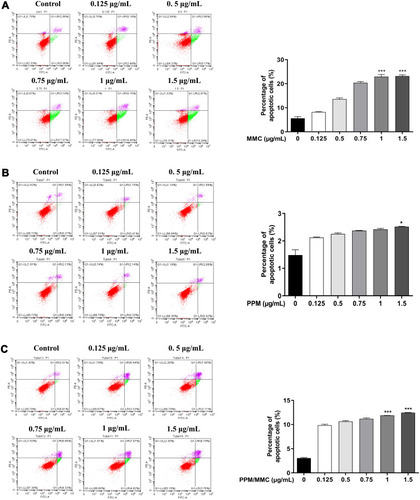
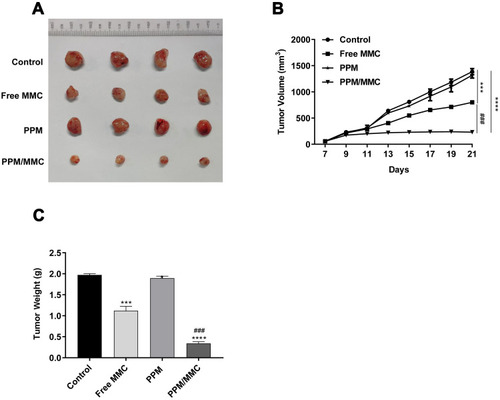
Figure 6 (A) The tumor volume of C57BL/6 nude mice on the 21st day. (B) Tumor volume of mice was detected after different treatments (saline, free MMC, PPM alone, and MMC-loaded PPM) (n=4 per group). (C) Tumor weight of mice was determined after different treatments. ***p<0.001 and ****p<0.0001, compared with control group. ###p<0.001, compared with free MMC group.