Figures & data
Table 1 Clinical Characteristics of 81 Patients with Glioma
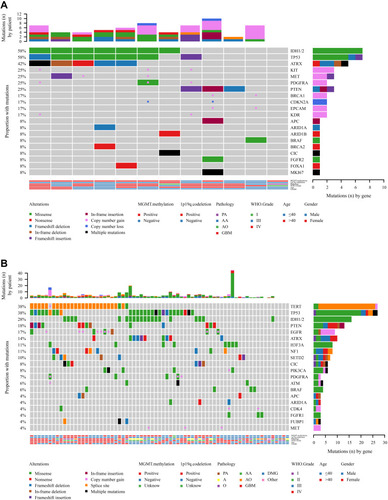
Figure 1 The landscape of genetic alterations in 75 of 83 samples (90.36%) from 81 glioma cases. Genetic mutations were identified by targeted next-generation sequencing in the tumor tissues of patients. The upper panel shows the numbers of nonsynonymous single‑nucleotide variants, small insertions or deletions and copy number variants in each tumor. The heat map below shows genes with somatic mutations sorted according to the mutation frequency. Mutations (n) is the number of mutations per gene.
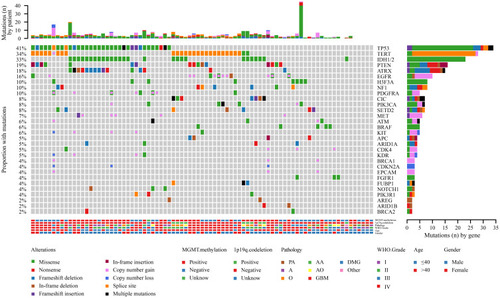
Figure 2 Comparison of mutation frequencies of the top 25 genes from the Chinese and MSKCC cohorts. Commonly mutated genes are arranged in order on the horizontal axis. The vertical axis represents the mutation frequency obtained from a different cohort.
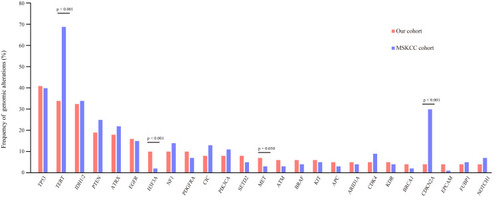
Figure 3 Concurrent and mutually exclusive somatic mutation patterns of significantly mutated genes. Significance was calculated using Fisher’s exact test, *p < 0.05.
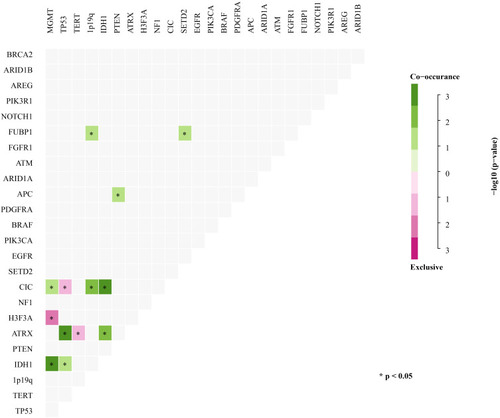
Table 2 Distributions of Representative Genomic Alterations and Clinical Characteristics Between the Different Pathological Subtypes with Glioma
Figure 4 Copy number variation (CNV) analysis. (A) Distribution shift of CNVs in 26 of 83 glioma samples (31.33%). Copy number losses (blue) and gains (pink) were determined from sequencing data. CNVs (n) is the number of mutations per gene. (B) Comparison of mutation frequencies of CNVs among the top 15 genes from the Chinese and MSKCC cohorts. The commonly CNV genes are arranged in order on the horizontal axis. The vertical axis represents the CNV frequency obtained from a different cohort.
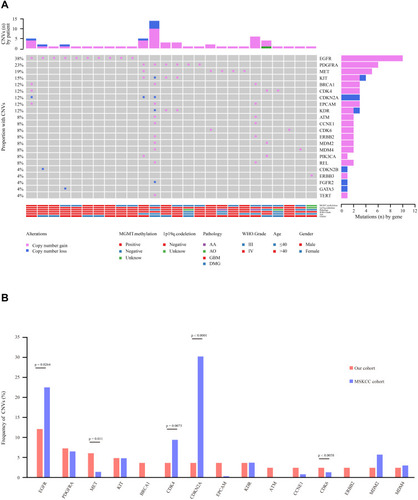
Figure 5 Comprehensive molecular profiles of different pathological subtypes.
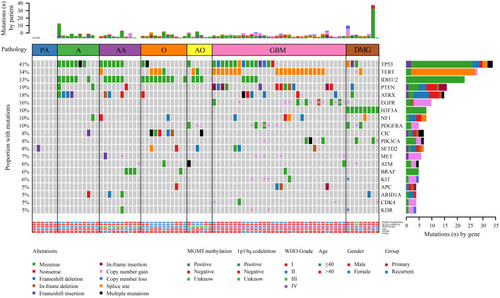
Table 3 Comparison of Important Genes with Somatic Alterations and Clinical Characteristics in Low-Grade (I–II) and High-Grade (III–IV) of Glioma
Figure 6 Comparison of the mutational landscape between low-grade (I–II) and high-grade (III–IV) glioma.
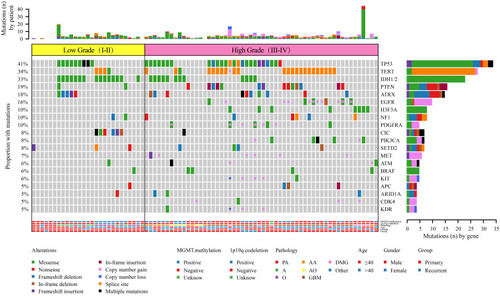
Table 4 Overview of the Distinctive Characteristics for Primary and Recurrent Glioma
Figure 7 Mutational landscape of (A) primary gliomas and (B) recurrent gliomas.