Figures & data
Figure 1 DEGs identification and Construction of the PPI network. (A) The heatmap of DEGs between the LIHC and adjacent non-tumorous tissues. (B) Protein-protein interaction (PPI) network of 185 common DEGs. Upregulated DEGs were labeled in red and down-regulated were labeled in blue; p-value and fold change were log-transformed, and applied as the bolder with and node fill color; topological degree was used as the criteria for node size.
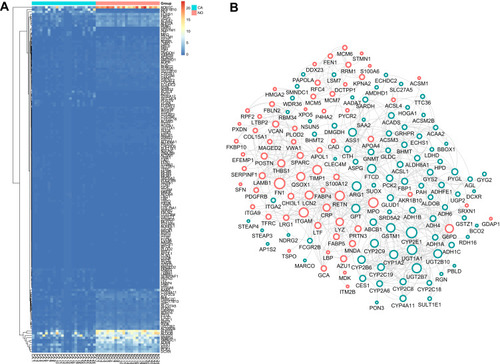
Figure 2 Functional analysis of common DEGs. (A) The top 10 significantly enriched GO-biological processes of the 185 DEGs; (B) The top 10 significantly enriched GO-cellular component of the 185 DEGs; (C) The top 10 significantly enriched GO-molecular function of the 185 DEGs; (D) The top 10 significantly enriched KEGG pathway enrichment analysis of the 185 DEGs.
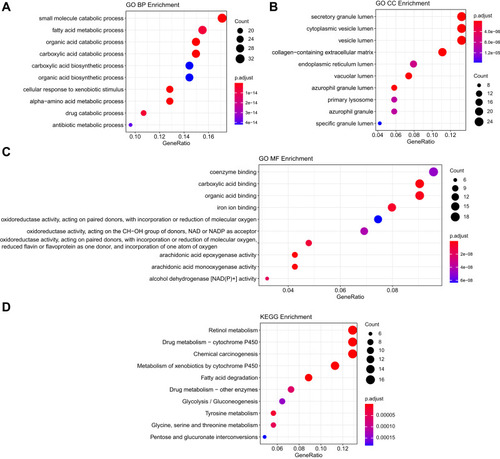
Figure 3 WGCNA analysis of the LIHC proteome profiling. (A) Samples clustering were conducted to detect outliers between the LIHC and adjacent non-tumorous tissues; (B) Analysis of the scale-free topology model fit index for soft threshold powers (β); (C) Cluster dendrogram was generated by hierarchical clustering to show the modules of highly interconnected groups of genes between LIHC and adjacent non-tumorous tissues; (D) Interactive relationship analysis of co-expression genes. The light color indicates topological overlap, while the darker color indicates a high topological overlap. (E) The heatmap shows the eigengene adjacency. (F) Heatmap of the correlation between module eigengenes and clinical traits. P-value is shown in each color cell coded by the correlation between modules and traits (red indicates positive correlation; blue indicates negative correlation).
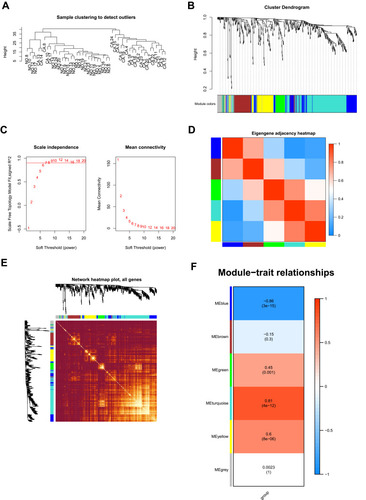
Table 1 Clinical Features of the Patients with LIHC
Figure 4 Construction and assessment of pivotal genes for predicting progression. (A) The common genes between our DEGs, proteomic turquoise module, TCGA cohort DEGs and TCGA cohort KM of LIHC. (B) Univariate-Cox regression analysis for screening appropriate and significant features into final nomogram model (C) Multivariate-Cox regression analysis for screening appropriate and significant features into final nomogram model.
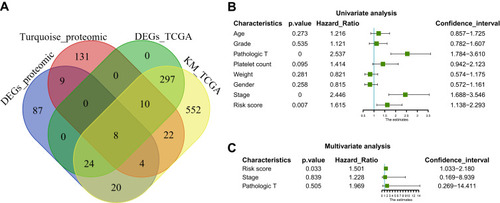
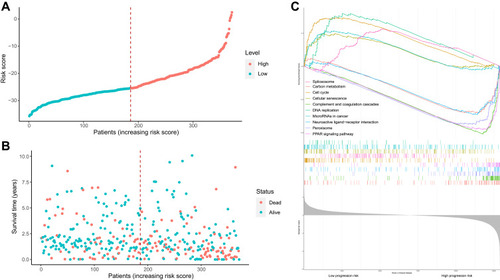
Figure 5 Risk score analysis, Kaplan–Meier analysis and time-dependent KEGG analysis for the validation of prognostic model. (A) Rank of risk score and distribution of groups. Patients with EC were divided into low- and high-risk subgroups based on the median value of the risk score calculated. (B) The survival status and survival time of patients with EC ranked by risk score. In (A and B), green dots represent for patients with a low level of risk score and red dots represent for patients with a high level of risk score. (C) KEGG pathway showed five positively correlated groups and five negatively correlated groups.