Figures & data
Figure 1 The levels of NLR, PLR, and LMR in the non-recurrent and recurrent groups. (A, B) The levels of NLR and PLR in the recurrent group were significantly higher than those in the non-recurrent group (P < 0.05). (C) The level of LMP in the recurrent group was significantly lower than that in the non-recurrent group (P < 0.05).
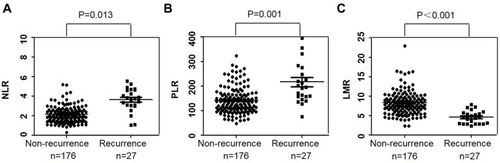
Table 1 The Optimal Cut-Off Values Based on Disease-Free Survival (DFS)
Figure 2 The ROC curves of NLR, PLR, and LMR. (A) The optimal cutoff value was 3.0 for the NLR (sensitivity 48.1%, specificity 86.4%, AUC 0.674). (B) The optimal cutoff value was 135.0 for the PLR (sensitivity 37.0%, specificity 85.2%, AUC 0.630). (C) The optimal cutoff value was 6.2 for the LMR (sensitivity 70.4%, specificity 76.1%, AUC 0.773).
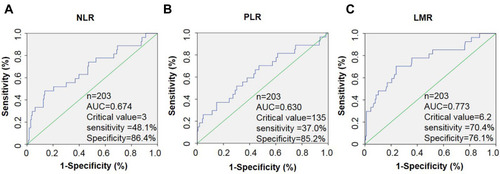
Table 2 Baseline Characteristics of the Patients According to the NLR, PLR and LMR
Table 3 Analysis of the Correlation Between Inflammatory Factors and pCR
Table 4 Prognostic Factors for Postoperative Disease-Free Survival in Breast Cancer
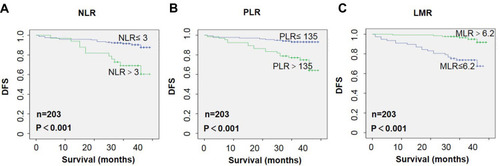
Figure 3 Kaplan–Meier analyses for disease-free survival (DFS) of all 203 patients. (A, B) An elevated neutrophil–lymphocyte ratio (NLR) and platelet–lymphocyte ratio (PLR) indicating poor DFS following surgical resection. (C) A low lymphocyte–monocyte ratio (LMR) indicating poor DFS.